You are using an out of date browser. It may not display this or other websites correctly.
You should upgrade or use an alternative browser.
You should upgrade or use an alternative browser.
My best performing funds YTD...
- Thread starter Gonzo
- Start date
cute fuzzy bunny
Give me a museum and I'll fill it. (Picasso) Give me a forum ...
Best:target retirement 2045 (5.33%) with windsor II (4.84) right behind it.
Worst: Vanguard high yield corporate (1.5%)
Worst: Vanguard high yield corporate (1.5%)
T
TromboneAl
Guest
According to Quicken:
VISGX - Small Cap Growth - 52.13%
But that can't be right -- the price has only gone up about 8%. I hate Quicken!
VISGX - Small Cap Growth - 52.13%
But that can't be right -- the price has only gone up about 8%. I hate Quicken!
T
TromboneAl
Guest
No, I told Quicken to give me YTD returns. I noticed in the Quicken report it says this at the bottom: "Securities held less than a year can yield inaccurate return calculations." If it can't figure out the rate of return, it shouldn't display it.
It's not rocket science -- but apparently Quicken can't handle this.
It's not rocket science -- but apparently Quicken can't handle this.
Attachments
cute fuzzy bunny
Give me a museum and I'll fill it. (Picasso) Give me a forum ...
Yow that sucks.
But you reminded me that I didnt check my IRA, so I was wrong. Best performer is small cap value at 7.21% ytd.
But you reminded me that I didnt check my IRA, so I was wrong. Best performer is small cap value at 7.21% ytd.
audreyh1
Give me a museum and I'll fill it. (Picasso) Give me a forum ...
My REIT funds - FRESX & CREEX are leading my portfolio by showing a 13% YTD performance.
Gosh - those REITs are like energizer bunnies!!!
Audrey
Gosh - those REITs are like energizer bunnies!!!
Audrey
Spanky
Thinks s/he gets paid by the post
Best fund: ICF (REIT)
Worst: PCRIX (Commodity)
Best Stock: CAMH (up 6x).
Worst: PCRIX (Commodity)
Best Stock: CAMH (up 6x).
It gave you what you asked for, not necessarily what you wanted.TromboneAl said:It's not rocket science -- but apparently Quicken can't handle this.
Quicken's performance numbers on some reports are an annualized internal rate of return (IRR). What you're looking at is the % your investment would have been up if it continued that rocket sled through 31 Dec 06.
If you go to the "Investing Center's" "Portfolio Display" (which may also be CTRL-U on your version of Quicken), click the Options button and Customize, you can select ROI%YTD which should give you a better number... like 10%.
AltaRed
Full time employment: Posting here.
Nords said:It gave you what you asked for, not necessarily what you wanted.
Quicken's performance numbers on some reports are an annualized internal rate of return (IRR). What you're looking at is the % your investment would have been up if it continued that rocket sled through 31 Dec 06.
If you go to the "Investing Center's" "Portfolio Display" (which may also be CTRL-U on your version of Quicken), click the Options button and Customize, you can select ROI%YTD which should give you a better number... like 10%.
Been looking to make this happen forever on Quicken 2002, but still cannot make any of that work. Either I have a mental block trying to find how to do it, or Quicken had no concept of the idea for 2002.
T
TromboneAl
Guest
Quicken's performance numbers on some reports are an annualized internal rate of return (IRR). What you're looking at is the % your investment would have been up if it continued that rocket sled through 31 Dec 06.
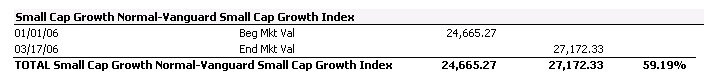
That's how I'd like it to work. I always like to deal in annualized returns. But here's how I calculate it:
27172.33 / 24665.27 = 1.1016 = 10.16% increase
That's for 3.5 months. Multiply by 12/3.5 and it comes to 34.85%.
Is it because I leave out the compounding that I get 34.85% and Quicken gets 59.19 %?
I did ($27,172.33 - 24,665.27)/$24,665.27 x 365 / (31+28+17) = 48.8% which, for daily compounding instead of monthly, is closer by a hand grenade.TromboneAl said:That's how I'd like it to work. I always like to deal in annualized returns.
But I think the actual number used by Quicken is derived from daily compounding of FV = PV (1+%)^^n
and % = [nth root of (FV/PV)] -1 = [(365/76)th root of ($27172.33/24665.27)] -1
= 59.186951%
Which is highly precise, at least as accurate, yet utterly meaningless.
As for our retirement portfolio, the S&P600 Small-cap Value ETF (IJS) is up 11.5% YTD and I hope it rests on its laurels for the remaining 289 days.
Tweedy, Browne Global Value (TBGVX) is up 8% despite holding at least 20% cash.
On the individual stock side, Tate & Lyle PLC (TATYY), the maker of Splenda, is up 9%, Sun (SUNW) is up 13%, Dolby (DLB) is up 20% (sell!), and that #$%^ing heartbreaker Nortel (NT) has managed to shed yet another 4%. Everything else is up 1-5%.
T
TromboneAl
Guest
Thanks, Nords. It's good to know that Quicken isn't just making random mistakes.
I didn't say that!!! Just not on this one particular calculation...TromboneAl said:It's good to know that Quicken isn't just making random mistakes.
Spanky
Thinks s/he gets paid by the post
Cash Flows
Deposits
& Withdrawals Dates Balance XIRR Return YTD Return
$24,655.27 Jan 1/06
Mar 17/06 ($27,172.22) 60.5% 10.2%
Deposits
& Withdrawals Dates Balance XIRR Return YTD Return
$24,655.27 Jan 1/06
Mar 17/06 ($27,172.22) 60.5% 10.2%
Brat
Give me a museum and I'll fill it. (Picasso) Give me a forum ...
OK, I'll bite. I am using Yahoo's chart for data ending 2/28:
MINDX 9.91% (India)
FICDX 6.19% (Canada)
These are not core holdings, relatively small $$ to juce up balanced funds that tend to plod along.
MINDX 9.91% (India)
FICDX 6.19% (Canada)
These are not core holdings, relatively small $$ to juce up balanced funds that tend to plod along.
HFWR
Give me a museum and I'll fill it. (Picasso) Give me a forum ...
FUND 1/3/2006 3/17/2006 GAIN %
CEE $43.65 $49.51 $5.86 13.4%
EFV $58.16 $61.87 $3.71 6.4%
FDM $21.00 $22.36 $1.36 6.5%
GLD $53.12 $55.12 $2.00 3.8%
IGR $16.59 $18.07 $1.48 8.9%
IWC $51.95 $56.60 $4.65 9.0%
IWN $67.23 $73.21 $5.98 8.9%
JKL $71.71 $77.15 $5.44 7.6%
PCL $36.84 $37.46 $0.62 1.7%
PWY $15.76 $16.71 $0.95 6.0%
PZI $15.33 $16.59 $1.26 8.2%
RWR $68.97 $79.09 $10.12 14.7%
TIP $103.04 $101.89 -$1.15 -1.1%
VBR $61.82 $66.80 $4.98 8.1%
VEIEX $19.67 $21.08 $1.41 7.2%
VWO $62.90 $67.19 $4.29 6.8%
Partial port, since I'm at work, and only have limited time...
HFWR
Give me a museum and I'll fill it. (Picasso) Give me a forum ...
LOL! said:Fuzzy math, HFWR? Or your RWR is not the same as my RWR which is up about 15% YTD.
Me fuzzy?

10.12 gain divided by the 1/3/06 close of 68.97, let's see, carry the one...
Oops, operator error...

I will update...
Have Fuzz, Will Retry
cute fuzzy bunny
Give me a museum and I'll fill it. (Picasso) Give me a forum ...
Hey...no fuzz without royalty payments
Spanky
Thinks s/he gets paid by the post
That's a great return.mslulu2 said:my calculation: 11% ytd
dex
Give me a museum and I'll fill it. (Picasso) Give me a forum ...
- Joined
- Oct 28, 2003
- Messages
- 5,105
Cute n Fuzzy Bun'ny said:Best:target retirement 2045 (5.33%) with windsor II (4.84) right behind it.
Worst: Vanguard high yield corporate (1.5%)
I think the Vanguard high yield has more downside to it.
Similar threads
- Replies
- 64
- Views
- 6K
- Replies
- 3
- Views
- 1K
- Replies
- 95
- Views
- 14K