My Lessons Learned and why everyone should build a custom model with Excel

It's interesting there are several people here with elaborate DIY spreadsheets for retirement planning accumulation and/or distribution. I don't recall ever seeing anyone report back on how they fared in retrospect? I did one in 2008, and it doesn't have any built in errors, but where we are in 2021 bears little resemblance to what my spreadsheet predicted...

I learned a great deal building budget/spending, investing/AA/net worth, tax planning/est taxes, and long range retirement planning spreadsheets, so it wasn't time wasted - but I recognized going in there was no way to get all the assumptions right, so they're just ROM results. I still use/maintain the first three but the long range retirement planning spreadsheet hasn't proven to be a great tool...and I don't maintain it.

That will be interesting to track, based on past experiences, I don't expect it to be accurate at all. I see them as a device to help go through the thinking process to make decisions.

I have been tracking my finances through excel for over 20 years and my prediction on where I would be has never been correct. That is understanding many things are out of my control. Maybe I would be no better off just winging it, I don't think so though.

The current sheet has told me I can retire now along with Firecalc and some other tools. My data in 2016 showed I would have to work another 5 years to be at this point

I regularly archive these sheets and relook at them several years down the road to see how I am doing. Up to now it has always been better than I predicted, but downturns cycles are in the future.

When I build something I learn something. Often more from the mistakes I made :) These spreadsheets enable me to learn about the different variables and how they can effect me to make decisions on what I can control in the equation. As long as I stay ahead of the game, they have meet their purpose
 
I know first post so take it for what it is worth. I also apologize in advance for any spelling errors :)

Lesson learned will actually come from how well my model tracks to reality in the future. This is about how I learned to create and update my model to hopefully cover the basis and help me make decisions ahead of time.

First off I am not a Tax expert, Financial expert and make no claims to the validity of what I am posting below. My goal here is to share the lessons learned I have from developing my own model over several years and illustrate its all about finding a balance based on your unique set of variables. You can do all this from an Excel spreadsheet fully understanding your choices rather than paying a financial planner to do this wondering if they considered everything they should

I have been modeling my retirement for a while now. Continually updating my excel spreadsheet as I saw things I didn’t consider. I am not going to share my spreadsheet as its pretty custom to my situation as yours should be. I will be retiring the end of the year

The biggest decision besides when to retire for me is what to do about my IRA for Roth Conversions and when to take Social Security

My goal is to maintain our current lifestyle and fortunately I have a pension that starts this month at 60 that helps that. That makes the choice as to when to take social security more flexible. I am down to 67 or 70

Planning Expenses:
• Before I created the detailed spreadsheet I reviewed 4 years of expenses.
• I then removed Mortgage (house paid off), 401K contributions, Health Insurance and taxes
• I then added in the Health Insurance cost I have from my employer for retiree Insurance. Just under $20K, very expensive. I wont qualify for any ACA subsidies
• II then added in other items like adding to the travel budget
• I then used 2021 Tax rates to estimate 2022 taxes
• I took the 4 years of adjusted expenses and added in Taxes and Health insurance and have a range of expenses for our current lifestyle.
• One of the years was much higher and went back in and removed wedding costs for my daughter that I hadn’t caught the first time.
• This resulted in a range that was +/- 10% from the average and so used these for planning
• I rounded up and down to provide 4 expense ranges that were equally separated but bounded the range. NOT The Graphs at the bottom
• I added these to the spread sheet column and escalated every year for inflation. I used 2%, but most others would likely do 3%. Its what you feel comfortable with reviewing what you spend money on
• Then I looked forward and how things would modify my expenses, Medicare at 65 will reduce Health care by $14K per what I have found, maybe more and I don’t expect to be doing all my same hobbies and traveling as much after 85, so slightly reduced income in that year
• This resulted in a 40 year estimation of my expenses over 4 expense rates. I have a goal rate (Expense per year) to work to, but wanted to make sure I had margin

Taxes:
• It’s hard to know if Tax Rates will change, I assumed they would not
• Tax Brackets due change. They go up 1 – 1.5% a year based on my quick estimation
• I created 4 columns for the 10, 12, 22 and 24% tax brackets and increased each year by 1%
• This was a later addition to my spreadsheet and because these brackets change the amount to convert to Roth staying in one bracket changes. Also, the impacts of RMD’s change based on where the tax brackets land. Again everyone’s situation is different that is why you need to develop and customize to your situation
• My state is a flat tax so I just modeled that in the expense

Return on Investment:
• This is the area that provides the greatest variance and one you have little control over in reality
• I see some like a 6% return. I have averaged over 12% the last 15 years, but I intend to go more conservative
• This is what I picked and you likely will pick something else. I modeled 1% (CD Rates), 2.5% and 3.9%. 3.9% was what I saw as a conservative long term rate that several “experts” that was a safe bet. I did not cover negative returns, which is a risk. I will just need to have enough in cash to work through a downturn
• I also did a stress test at 0% and verified my money would last but at a slightly reduced income until 95
• To be extra conservative, I did not consider selling my house. Again your situation will be different

Roth Conversions:
• At a high level, converting all the IRA into a Roth sounded great. I would eliminate the need for RMDs and always be in the 12% tax bracket
• In my situation, the only time this worked out to be the best option is if the ROI was 1% or lower
• That is because your ROI growing your savings is almost nil and it ends up being down to expenses
• At higher ROIs, doing the mass conversion up front lowered the amount and time my money would last
• Doing no conversions didn’t work either as the RMDs drove me to a higher tax bracket
• I modeled two types of Roth conversions: MIN: capped to the 22% bracket, MAX: Capped to the 24% tax bracket. I so no reason to model to the 32% bracket
• This why having the tax brackets escalate each year by 1% is important as it changes the thresholds for MIN, MAX or however you want to do it
• For Min, I modeled to the 22% bracket until RMDs started. I will reevaluate if I should continue them after RMDs start. The RMDs of course reduce the amount to convert to get to the 22% bracket. Being 12 years from RMD’s I figured this was good enough and my model shows the answer is different at 72 based on the ROI I actually achieve
• For Max, I did conversions to the 22% bracket until they conversion was complete resulting in no RMDs, but a significantly reduce investment balance to gain returns on
• For Max, I had a significantly reduced tax bill lowering expenses, but had a major smaller investment base to pull it from
• For Min, I had a lower tax bill than no conversions, a small RMD that fit within my expenses. Meaning I did not have to have more income than I needed
• For no conversions, the RMD drove me to have more income then I needed with the pension and social security and as a result a higher tax bil


Social Security:
• I came down to two points after running through models early on, 67 and 70
• Early models clearly showed SS at 70 is the right answer
• When you factor in Roth conversions, ROI and RMDs, in some situations 67 is actually better until about age 95 (Changes based on variables)
• I used my pension, RMDs and 85% of social security to define the taxable portion of my income along as anything else I may or may not need will now come from the ROTH
• In some cases in my situation, the Pension, RMDs and SS at 70 drove my taxable income above what I needed where as taking it at 67 would not. In these situations; Pension, RMDs and SS @67 required almost nothing from my Roth which is able to sit and grow creating a larger investment balance
• This sweet spot all changes based on your IRA to Roth situation, Resultant RMDs, having a pension and ROI

Conclusion:
It all comes down to finding the right balance for your situation. Using FireCALC is great to do a sanity check, but it doesn’t allow you to fully model your unique situation, tweaking individual variables to find the best balance and sweet spot for you

Having your own model allows you to go in and update for progress and make any modifications. I expect the answer for 67 to 70 may change based on actual performance and expenses and I know I don’t have to make that decision for a few years.

Based on my situation and models, I have decided to do min Roth conversions to the 22% bracket until age 72. At that time I can always make the decision to continue them on top of RMDs. Or, if things significantly change with a higher ROI than I expect, I may decide to switch to the max conversions (24% bracket)

I am no tax or financial expert. Just an engineer who is use to modeling all kinds of scenarios. Please don’t take anything I said her as gospel as to what you should do. My entire point in sharing this si everyone’s situation is different and using Excel to model your unique situation will help YOU find the right balance.

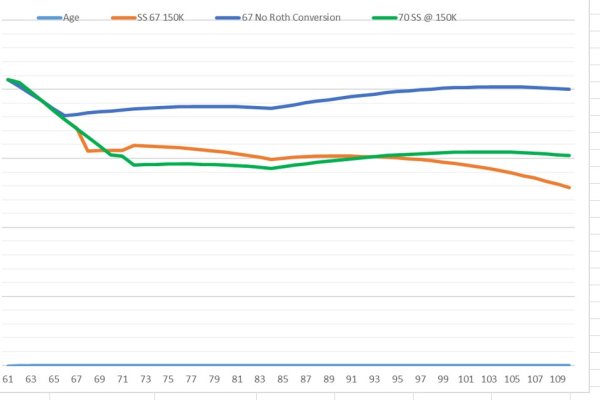
The bottom 3 graphs are of my situation to illustrate how things vary. For the 1% ROI you can see that at age 85, SS at 70 and Max Roth conversion is the best option because investment isn't growing so lower Tax expense is the better outcome for funds lasting longer

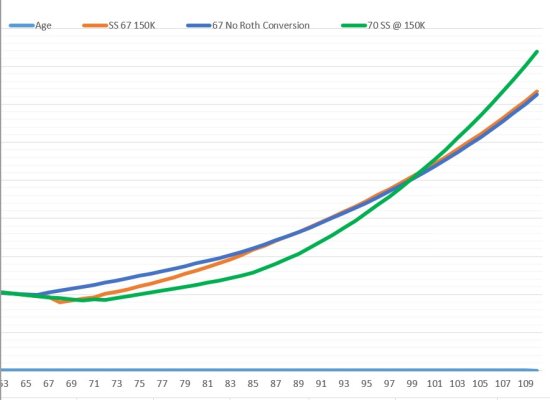
the 2.5% graph shows that the ROI is significant enough to outweigh the benefit of the lower tax of the full conversions. It shows SS at 70 overtakes SS at 67 at about age 86. No Roth conversions is the worst option as RMDs drive income above what is need

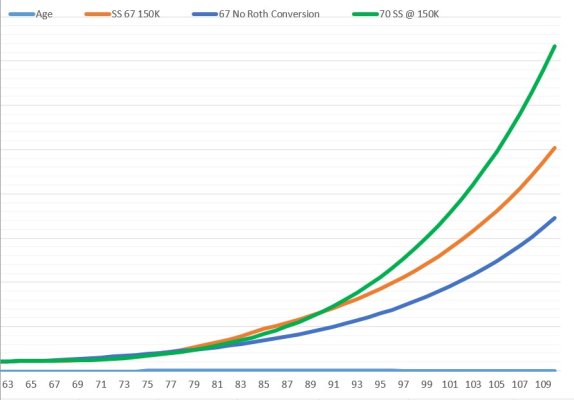
The 3.9% Graph shows the min ROTH option is the better solution as it has more base to grow with the higher ROI. Also the Higher ROI moves the date SS@70 overtakes SS@67 to about 93 years old. This shows even higher rates will move that later

Again these graphs are MY SITUATION. The answers will be different for you and to just illustrate why you should develop your own model and tweak it to evaluate multiple scenarios to find the sweet spot

Sorry for the long first post

You, sir, are a genius. Well done. Bravo. I can't find fault in anything in the original post after a brief run through.

Building one's own financial model is consistent with eating right and exercising to take responsibility for both one's own financial house and physical/bodily house. Read the Health section of this site for people who want to "let themselves go" physically. That's a digression.

I smiled when I saw your charts showing Roth conversion and SS claiming scenarios.

Roth conversions make one poorer, up to the breakeven age. One impoverishes oneself by doing Roth conversions. Your charts show a breakeven at age 90+. This is consistent with McQuarrie's writings. And consistent with my own Excel model.

I will follow your posts as it seems like we have similar personal finance management styles.

My main takeaway from your original post: Roth conversions make me poorer until so late in life it doesn't matter.

Keep going and keep posting.
 
@Romer I am super impressed with your work.

Can you run a SS at age 62, no Roth, 8% return scenario? And chart it as you did in the original post?
 
I did many spreadsheets in my working years so felt very equipped to tackle this. I built four flavors of spreadsheet with roughly the same inputs, one with assumed rates of return and input SS claim dates, a second one to optimize my SS claim date, a third one to optimize DW's SS claim date and a fourth one with historical data and did countless cases and graphs.

Then I bothered to look at the internet and found I had completely missed the effects of IRMAA and of ACA subsidies and had done the RMD calculation wrong for a small stretch IRA I inherited. And that there were free tools that could do most of what my sheets did (or sometimes better)

-The Retiree Portfolio Model available at bogleheads.org was more thorough on the case of looking at fixed rates of return and fixed SS claim dates,
-I-orp (Extended version) did a full plan including Roth conversions from the same input and often suggests non-intuitive solutions
-Opensocialsecurity.com did a better job on finding the optimum SS options for both me and the wife
-and of course FireCalc, which did historical modeling.

So I said pfui, building my own models turned out to be a learning exercise, but I didn't actually do much better and sometimes worse than the free products on the internet.

Then I found Pralana Gold ($99 1st year/$49 renewal, requires Excel). It has very flexible ability to handle all kinds of assets, income, expenses. Its tax package is stronger than any of the free tools with IRMAA, ACA subsidies, existing LTCGs, AMT, deduction phaseouts, non deductible contributions in IRAs, etc. You can do SS claim optimization studies, it has historical performance bands, various withdrawal methods, Roth conversions, glide paths, etc. So I mostly just use that now, with occasional cross checking in other tools.
 
@Romer I am super impressed with your work.

Can you run a SS at age 62, no Roth, 8% return scenario? And chart it as you did in the original post?

I appreciate the positive comment

My sheet is customized for many of my variables and wouldn't give you the answers you are looking for. I have a Pension and likely different expense/income point. I don't really want to chart other peoples situations as then you may make decisions on bad information from me.

I would try FireCALC though you can customize it to what you are looking for
 
... I learned a great deal building budget/spending, investing/AA/net worth, tax planning/est taxes, and long range retirement planning spreadsheets, so it wasn't time wasted - but I recognized going in there was no way to get all the assumptions right, so they're just ROM results. I still use/maintain the first three but the long range retirement planning spreadsheet hasn't proven to be a great tool...and I don't maintain it.
Yup, me too. Over the years, pre- and post- retirement I have found that spending time wallowing in the numbers of a planning spreadsheet to be of great value. Not at all like having someone from Accounting do it for me. At the end, the one thing I know is that the spreadsheet's prediction will not happen. But I have learned a lot of valuable things along the way and I have been forced to think about the future in more detail than prior. Time well spent.
 
My main takeaway from your original post: Roth conversions make me poorer until so late in life it doesn't matter.

Thanks for the kind words. I am lacking in knowledge to many others on this site. That is why I am here to learn

My takeaway from Roth conversions is finding the balance to make sure RMDs don't provide more income that you need driving you into a higher tax situation. Without any Conversion, RMDs drove my income $30-40K more than I needed. Maybe that's a lot to worry about nothing as this excess income can go into an after tax account for investing. I like having a Roth with Tax free income for later years and also to make it easier for me kids. My Dad kept saying over several years before he died, "That will be your problem" on many topics. And it all became my problem after he died. I want to make things as easy as I can for my kids
 
Last edited:
It's interesting there are several people here with elaborate DIY spreadsheets for retirement planning accumulation and/or distribution. I don't recall ever seeing anyone report back on how they fared in retrospect? I did one in 2008, and it doesn't have any built in errors, but where we are in 2021 bears little resemblance to what my spreadsheet predicted...
I have a vague memory of a couple of errors in my spreadsheets years ago. I think they had me converting Roths a little too much, so it was just a small creep into a higher bracket. Now I've got my yearly income forecast dialed in so I can get my Roth conversions pretty much on the nose. I leave a buffer when the ACA cliff is a concern.

I've made mods to my investment Net Worth spreadsheet but I don't know that I had any real errors in it. I use it yearly to feed into my VPW spreadsheet, which has set my spending allowance target for the last 7 years. That's held up just fine for me.
 
Thanks for the kind words. I am lacking in knowledge to many others on this site. That is why I am here to learn

My takeaway from Roth conversions is finding the balance to make sure RMDs don't provide more income that you need driving you into a higher tax situation. Without any Conversion, RMDs drove my income $30-40K more than I needed. Maybe that's a lot to worry about nothing as this excess income can go into an after tax account for investing. I like having a Roth with Tax free income for later years and also to make it easier for me kids. My Dad kept saying over several years before he died, "That will be your problem" on many topics. And it all became my problem after he died. I want to make things as easy as I can for my kids

@Romer have a look at your net worth over time for the scenarios you charted. Assuming the charts account for income taxes, the Roth lines on the chart are lower, which means you are poorer, for having contemplated a Roth conversion.

Roth conversions make one poorer on the day they are executed.

Regarding your comment on other’s situations using your model. I understand the point. I have done these simulations using my model. I’m curious to see the effect of claiming at 62 with and without Roth conversions with another set of eyes. Forget the 8% return number, use whatever rate of return you want, 3.9% for example as in your last chart.


What I am saying is your charts leave the question unanswered as to the effect of taking SS at 62. You might find it interesting to know this.
 
I have previously modeled SS at 62, 64, 67 and 70 and dropped 62 and 64 as options. I ran out of money much faster than I wanted. Not saying it wouldn't last me, just made me uncomfortable and I see no reason to revisit it

I understand your perspective on being poorer. Everything is a balance is what i have learned over my life. That graph doesn't show my net worth, only retirement accounts.

@Romer makes sense. I see that the analysis you have done applies to any portfolio. I use the word portfolio in an all inclusive way, which means include all debt (mortgage, car loans, student loans, all of it) and assets (cash, investments, real estate/principal dwelling, all of it). Your analysis framework holds water when applied strictly to retirement accounts as you have done, and also to one’s comprehensive financial situation. Again, well done.

As I absorb over time your excellent original post, the Roth impoverishing effect is very strongly seen in the lines “55-70” min and max Roth. Max Roth is a worse outcome than min Roth.
 
Last edited:
Welcome! I'm not a spreadsheet guy (despite being a computer programmer) but have tried numerous retirement calculators. For me the "Flexible Retirement Planner" (https://www.flexibleretirementplanner.com/wp/) has been my favorite planner. It's easy to experiment with numerous inputs and scenarios to see what the results will be.

Has anyone gotten this link to work?
 
@Romer makes sense. I see that the analysis you have done applies to any portfolio. I use the word portfolio in an all inclusive way, which means include all debt (mortgage, car loans, student loans, all of it) and assets (cash, investments, real estate/principal dwelling, all of it). Your analysis framework holds water when applied strictly to retirement accounts as you have done, and also to one’s comprehensive financial situation. Again, well done.

As I absorb over time your excellent original post, the Roth impoverishing effect is very strongly seen in the lines “55-70” min and max Roth. Max Roth is a worse outcome than min Roth.


Exactly. Why I am looking at min Roth only. It looks like the right balance for me. It makes my RMDs after 72 low enough it still fits within my desired income and essentially I don't have to take any money out of the Roth allowing it to grow. I stop converting at 72 when RMDs start to limit my taxable income, but will relook at it every year based on performance to see if I want to continue at a lower level

Going min, my net conversion is only about $50K a year and it puts $550K in the Roth when RMDs start. That $550K will be allowed to grow tax free untouched and will bee there if things change and I need it, or for my kids.

As everyone pointed out nothing ever works out as you planned and I will likely modify my path based on a yearly review of the data. I am using it to decide what to do in 2022 and everything else is tentative. I will decide SS at 67 or later when I am 66.5. I have a thought which way to go, but that is too far in the future to make a firm decision. The only decision I have made is not before 67 to maximize spousal benefits which I learned about from this site and wasnt in my first post
 
Last edited:
This is a great approach to modeling the overall retirement picture and I did the same. Really forces you to understand the complexity and impact of certain factors and decisions to be made in retirement. I spent -4 years building and refining my model to correct inaccuracies, and adding functionality to various scenarios. Don’t just take the canned models at face value. In addition, I used the FIDO planner as another data point however it assumes a fixed rate of inflation. Didn’t like not being able to model various inflation scenarios sot this became an integral part of my model.
 
Probably the biggest benefit of all this intensive modeling is that it shows people are considering all of the details before pulling the plug, which is great. The psychology behind it many times is because the modelers believe this gives them more control over what will happen in the future, which is probably not the case. Personally, I just took a more simplistic approach and made sure I had more than 3X what I estimated I would need, which should help balance out the unanticipated scenarios which are simply impossible to predict or model.
 
I model expenses in nominal dollars (constant now year) and use real returns. So much easier than plugging inflation guesses in all over the place.

I did take a copy of my model and convert it to real dollars and nominal returns and the answer was about the same. My pension and SS are COLA'd and my healthcare is free so there should be no real inflation impact for me. Except for my mortgage. Sure is nice watching the nominal P&I payment go down by inflation each year.
 
Welcome! I'm not a spreadsheet guy (despite being a computer programmer) but have tried numerous retirement calculators. For me the "Flexible Retirement Planner" (https://www.flexibleretirementplanner.com/wp/) has been my favorite planner. It's easy to experiment with numerous inputs and scenarios to see what the results will be.

ditto - this has been my goto app given the granularity that you can add from expenses, inflation adjustments or portfolio return ranges. extremely flexible!
 
Thanks for providing the details as well as your thought processes - that greatly helps in not only giving a general starting point but many tips and hints on what and how to further customize!
 
I'm an engineer and do not keep or in the past used any type of spreadsheet with the level of detail that OP and many reply persons here do. I have one basic all-in number for spending each month, and have my regular money set up to cover that. It has two basic categories: fixed and discretionary; which of course discretionary can change a lot. If I do need more to cover a larger one time expense, I sell something and get money. Fidelity Income Planner and Firecalc both give me good results.

I guess that I have "enough" in the nest egg, and confidence in my investments, coupled with a lower than 4% withdrawal rate. I can keep my normal expenses within the regular budget, that I just do not feel any need to get serious with detail on a spreadsheet and micro budgeting. It works for me. I may not optimize to the absolute best, but do use tax rates and conversions to help my short and long term planning.
 
Just an update about how great this site is. Due to discussions here and links I learned some things, some new lessons that I applied into my spreadsheet. I didnt update the spreadsheet because I think it will be a better predictor for the future. It did help me understand the new tweaks and how it impacts things. I learn by making something. When I got a job on a new spacecraft program, first thing I do is draw out the entire system. This makes me ask questions to understand how things work and by the time I am done, I have learned this new system and am better able to manage it. I could have looked at existing drawings and just been satisfied, its the making it myself that forces me to learn and ask questions. I do use the existing drawings as reference for an end to end drawing. I see the spreadsheet in a similar way helping me understand all the end to end parameters and things to consider, not as an accurate prediction

What did I learn?
- Social Security Spousal Benefits. I had no clue and what a pleasant surprise
- In My situation, taking SS at 67 and my the spousal benefit at 67, is a better options for 25-35 years depending on ROI for investments. Just to far in the future to worry about. If looks the same at 66, go for FRA at 67.
- When RMDs drive you above your needed cash, make sure the extra goes into an after tax savings account vs a ROTH
- Roth Conversions are not an automatic good thing. A consideration for a spouse after death due to different tax brackets makes it a benefit, Tax Free inheritance for your kids, or if it helps avoid going into a higher tax bracket when the RMD comes. A near term example is to convert now if you will be in the same bracket in case Tax law does increase tax rates in 2026

There has been and certainly will be more

Thanks everyone for the great welcome, wonderful site and having a place to politely discuss options and learn
 
Last edited:
Just an update about how great this site is. Due to discussions here and links I learned some things, some new lessons that I applied into my spreadsheet. I didnt update the spreadsheet because I think it will be a better predictor for the future. It did help me understand the new tweaks and how it impacts things. I learn by making something. When I got a job on a new spacecraft program, first thing I do is draw out the entire system. This makes me ask questions to understand how things work and by the time I am done, I have learned this new system and am better able to manage it. I could have looked at existing drawings and just been satisfied, its the making it myself that forces me to learn and ask questions. I do use the existing drawings as reference for an end to end drawing. I see the spreadsheet in a similar way helping me understand all the end to end parameters and things to consider, not as an accurate prediction

What did I learn?
- Social Security Spousal Benefits. I had no clue and what a pleasant surprise
- In My situation, taking SS at 67 and my the spousal benefit at 67, is a better options for 25-35 years depending on ROI for investments. Just to far in the future to worry about. If looks the same at 66, go for FRA at 67.
- When RMDs drive you above your needed cash, make sure the extra goes into an after tax savings account vs a ROTH
- Roth Conversions are not an automatic good thing. A consideration for a spouse after death due to different tax brackets makes it a benefit, Tax Free inheritance for your kids, or if it helps avoid going into a higher tax bracket when the RMD comes. A near term example is to convert now if you will be in the same bracket in case Tax law does increase tax rates in 2026

There has been and certainly will be more

Thanks everyone for the great welcome, wonderful site and having a place to politely discuss options and learn

Well done. I can’t argue with anything you have posted. It’s good to have you on the site. Please keep posting, particularly your charts showing different scenarios. You can non-dimensionalize the vertical axis if you like to protect your privacy. Directional analysis is helpful to everyone.
 
I have learned some more so just updating this thread. I was surprised when I ran the numbers when I decided to retire a few months ago how much I actually could spend each year

Taking out expenses that no longer apply and adding in Taxes and Health insurance cost (60-65 are higher) I came up with a range of $130K to $150K over the last 4 years, buying what I want, traveling where we want, etc. Being a Car guy can be expensive. I wanted to make sure I could live the same lifestyle, so I used $150K for planning. I really hope this doesn't come across as bragging as I see here there are a lot of people living off much less and doing fine. I am only using this data point to help explain the graphs and thoughts below

Another good reason to develop a spread sheet as everyone's situations are different. It just seemed right that I should do Roth Conversions. And that still is the right answer in some cases, but not all

The one I will have to ponder is leaving less of a tax burden for my kids by doing the conversions no matter what


I had some errors in my spreadsheet which going through other peoples scenarios helped me think about and correct. It has changed the Roth conversion mix

Since with SS and my Pension starting at 67, I will always be in the 22% Bracket.

The variable on Roth conversions or no Roth Conversions comes down to ROI
Anything below a 4.25% return is better if I don’t convert as this reduces my balance via taxes enough that the investment grows faster without the conversions

At a 2.5% ROI (first Graph) it is always better not to do ROTH. They stay fairly constant after SS because my withdrawals are close to my earnings at 2.5%. Earnings are higher with no Roth because a larger investment balance

At 4.25% (Second Graph), SS at 67 and Roth conversions to the top of the 22% bracket becomes better after 25 years because the higher ROI drives greater RMDs ( way above my spending needs for the no Roth option lowering my balance due to paying taxes earlier and slowing future growth future growth


At an 7% ROI (Third Graph), the Roth conversion options become better in 17 years because smaller RMDs in the ROTH options drive less tax early, leaving a larger investment balance to grow

As a side note with the SS Spousal benefit.
- With my wife talking hers at 67 and me taking mine at 70 and she then going with the 60% spousal benefit
- vs my taking it at 67 with her taking the 50% spouse benefit then (We are the same age)

The payoff waiting until 70 vs both going at 67 is at 88 years old just comparing cumulative payments and not factoring in ROI. That is because her payments at 67 are very small as she was a homemaker. Taking the spouse benefit provides a significant ramp up that the higher 70 values take a long while to catch up
 

Attachments

  • 1.jpg
    1.jpg
    71.1 KB · Views: 39
  • 2.jpg
    2.jpg
    86.5 KB · Views: 31
  • 3.jpg
    3.jpg
    84.1 KB · Views: 30
Last edited:
The knob I can turn is expenses. I calculated I needed $125K to live the same lifestyle, with 3 big trips and not having to scrimp. I made my plan $150K to cover big ticket items like a car, new furnace, a big family trip. I wanted to make sure I could fully enjoy life when I decided to retire.

If I reduce spending down around what I think I actually will do, then 2.5% ROI changes to showing Roth conversions are the better option in 16 years, sooner if my expenses are less or my ROI is greater. I did not change the legends to say $130K.

This is because again the higher RMDs drive paying taxes earlier leaving less of a balance to grow. SS at 70 takes off as the higher SS Benefit finally catches up providing more investment to grow

so with Lower expenses, Roth Conversions become better

I should note in my situation I have a Pension and looking at SS as I discussed above. Those two together provide $108K of income at 67. Again your situation is different

The objective of my posts is to provide things to think about as you lay out your initial plan

Then update it every year based on actual performance in ROI and Expenses and other factors that may come up

The other item that may make Roth conversions more attractive is if we assume the tax rates will go up as planned in 2025. Then you would pay less tax now and that is always a reason to do it.

The other thing that would make sense is if you are in a lower tax bracket and expect to be in a higher one. Since I will be in the 22% bracket throughout my retirement, that wasn't a factor for me

Again, not an expert, just a guy with a spreadsheet trying to lay out my first few years
 

Attachments

  • 4.jpg
    4.jpg
    71.9 KB · Views: 28
Last edited:
The variable on Roth conversions or no Roth Conversions comes down to ROI
Anything below a 4.25% return is better if I don’t convert as this reduces my balance via taxes enough that the investment grows faster without the conversions

What does the y-axis on your graphs represent? I.e., are you distinguishing between the value of a dollar in Roth vs. traditional?

In my view, the performance of your investments does not affect the advisability of Roth conversions (due to the commutative law of multiplication). Only the marginal rate at conversion vs. withdrawal matters.
 
Back
Top Bottom