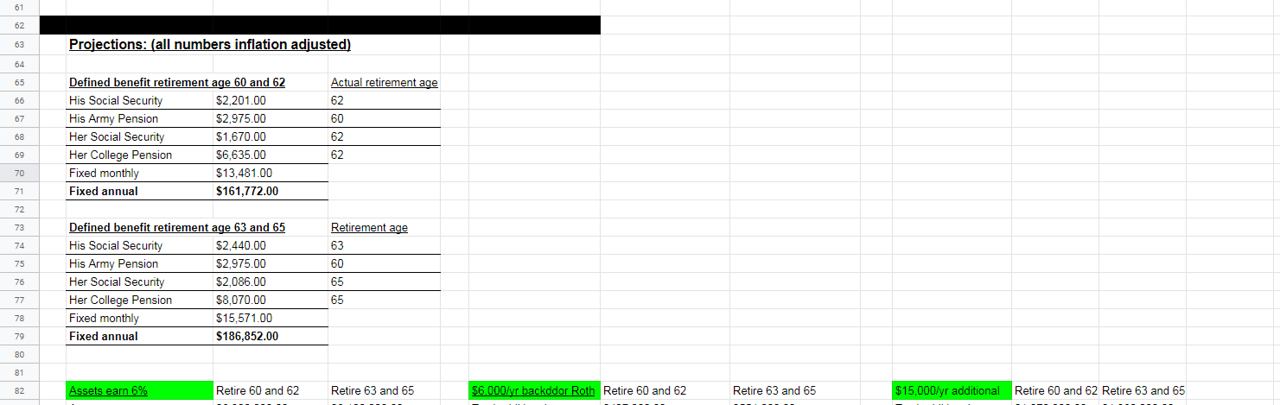
wow, dirtbiker, you start at 6% growth? {mine was much lower and included possibility of negative values}
when I was putting together mine, I had already put together five years of spending.... then used avg plus 25% ( to get a value approximately 1+ sigma above and give enough room for error) for required income
(that's one tab)
then had separate tabs for each of our income (with no bonus or increase/ with varying levels of increases and varying bonuses (none/usual expected/full expected bonus).... including amounts from each to max out retirement plans (HCE or not)
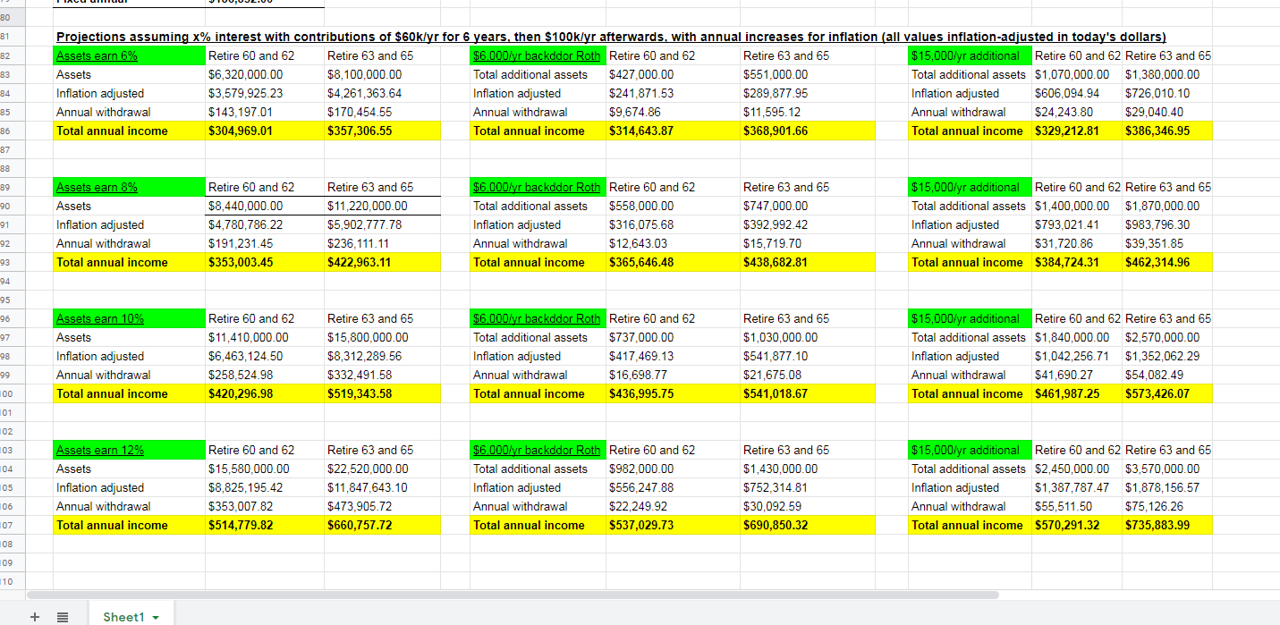
tabs for current 401 k, with amounts to be added, along with conservative growth amounts (2%,4%,6%, and of course zero and -2%, as well) (never modeled above 6%.... but used 3%-5% as worse case inflation. Note: 5% inflation is very hard to overcome, fortunately the Fed targets only 2%)
{likewise for taxable accounts, pension, Roth's, and SS (early, at FRA, and at 70)}
Then, like Pb4uski, I had a separate sheet drawing from each of these earlier tabs, with similar headings and had crude estimates and likely spendable income. ( I didn't model taxes .... good thing I didn't as it would have been wrong and a real waste of time. ) I only went out to 80.... if it failed before then I knew retirement would be too risky. Only later did I find the other calculators (Firecalc, etc) to plug the final numbers in as a test.... mine was conservative enough that it always came back at 100%, even with the 25% increase I baked in (some I considered as part of the surrogate for taxes).
[in our initial years, we've pulled less than 2 1/2%, even with major outlays (HVAC replacement/surgeries/ new vehicle)....
we use a max of 3.5% for WD, until SS start for me , (likely at FRA but could wait until 70) and other SS would be more gravy when it starts]


")