My S(?) WR

Very interesting thread so far and thanks to everyone for sharing.

Here are some stats for us:

Code:
year  spend  portfolio
2004  6.4%   15%
2005  3.7%   16%
2006  4.5%   14%
2007  5.2%   20%
2008  4.7%  -10%
2009  6.6%   -2%
2010  5.6%    0%
2011  4.8%  -11%
That last column is the inflation adjusted portfolio balance. I figure that is really the figure of merit for us. So we are down 11% from the start of retirement.

Besides my lack of great stock/bond returns, my excuses are:
1) Delaying SS until 2 years from now. DW started hers in 2010.
2) Helping DS get through college
3) Converted a lot of IRA money to Roth triggering heavier tax bite.

This year DS graduates from college and we will be taking some income from Roth's to reduce taxes a lot. When I take SS our spending could go down into the 3% range but I figure we will want to live it up a bit. Don't really want to be on one of those FIRECalc lines that go up and to the left. Flat might be better in terms of quality of life before we turn off the lights for good.

I've been independently thinking lately about your reason (3) Converted a lot of IRA money to Roth triggering heavier tax bite.) I'm coming to think of the taxes paid to convert as a "neutral" at worst. IOW, a case could be made NOT to include the tax bite of a Roth conversion in your WR. You are simply exchanging one asset (a tax-deferred one) for a tax "free" one. The cost to do so is the tax bite - but that "cost" is virtually converted to "value" within the Roth. So it could be looked at as "neutral". I'm certain it doesn't feel that way when you look at your cash stash or even your "unadjusted-for-future-taxes" net worth. In this case, I guess it's all about your viewpoint. YMMV.
 
I think Ripper was teasing a bit. I'm a cola'd pensioner (no health insurance), too and have never felt unwelcome over the issue. I think several threads in the past have shown opinions that the government should get out of the pension business, but never has anyone felt we should have them taken away. Midpack, you are certainly correct about different planning aspects though. Instead of me having a withdrawal rate, I am having a 20% deposit rate to be used in case my pension would ever get reduced. This forum has been very beneficial to me in realizing you shouldnt put all your trust in the government as things can change. If I had retired 15 years ago with a pension, I would have just spent it all and waited for the next one to come in the mail without a concern in the world.
I'm also aware that a government pension could get reduced. That is why I also decided to put away as much as I could in a 457 account that the City of Chicago offered through Nationwide. New hires now have to work longer and get some kind of 401k I believe. They are working on also changing benefits for current employees going forward. I think I am safe because I already retired but the COLA might be something they will look at.
 
I've been independently thinking lately about your reason (3) Converted a lot of IRA money to Roth triggering heavier tax bite.) I'm coming to think of the taxes paid to convert as a "neutral" at worst. IOW, a case could be made NOT to include the tax bite of a Roth conversion in your WR. You are simply exchanging one asset (a tax-deferred one) for a tax "free" one. The cost to do so is the tax bite - but that "cost" is virtually converted to "value" within the Roth. So it could be looked at as "neutral". I'm certain it doesn't feel that way when you look at your cash stash or even your "unadjusted-for-future-taxes" net worth. In this case, I guess it's all about your viewpoint. YMMV.
From just the standpoint of cash flows the taxes are money out the door. You are taking the hit now which hopefully is lower then the hit in future years when you withdraw from a Roth to lower your taxes (as we are going to do this year) and reduce your withdrawal rate then. Maybe I do not understand the argument for not calling it spending.

Just from a FIRECalc type of simulation, you would have to count any taxes in that year because they deplete the portfolio and the worry is that the portfolio would decline too far before it gets a chance to experience growth in later years (those lines that prematurely hit zero in the simulations).

In any case, it does affect the "figure of merit", i.e. the inflation adjusted retirement portfolio. That figure-of-merit is affected by (1) spending of all kinds less incoming cash flows like SS or pension, (2) the inflation rate, and (3) your investment returns.
 
Last edited:
I've been independently thinking lately about your reason (3) Converted a lot of IRA money to Roth triggering heavier tax bite.) I'm coming to think of the taxes paid to convert as a "neutral" at worst. IOW, a case could be made NOT to include the tax bite of a Roth conversion in your WR. You are simply exchanging one asset (a tax-deferred one) for a tax "free" one. The cost to do so is the tax bite - but that "cost" is virtually converted to "value" within the Roth. So it could be looked at as "neutral". I'm certain it doesn't feel that way when you look at your cash stash or even your "unadjusted-for-future-taxes" net worth. In this case, I guess it's all about your viewpoint. YMMV.

Interesting observation.

I agree that if the tax rate is constant and the earnings rate is the same that a tIRA to Roth conversion should be economically indifferent so one could argue that the tax outflow shouldn't be counted as a withdrawal. The reason so many of us do tIRA>Roth conversions is because we believe out current tax rate will be lower than our future tax rate when RMDs kick in.

I don't think many people think of the withdrawals for taxes as not counting towards the withdrawal rate (I don't) but there is an argument to be made that is valid.

If we included deferred taxes in computing our net worth, then a tIRA>Roth conversion wouldn't change our net worth, but very few people do that (I don't assuming, perhaps naively, that my effective tax rate in retirement will be minimal).
 
Maybe I do not understand the argument for not calling it spending.

Well, as you (and pb4uski) point out (and, I believe I alluded to) this is all quite in the eye of the beholder. I only pointed it out because IIRC, I listed last year's taxes (2010) in another thread as being high for the same reason (extra taxes, due to Roth conversion). Then, I began to rethink that statement.

I was simply suggesting that tIRAs and Roths can only be compared in terms of their "value" by recognizing the current taxes due at the time. If you are in a low tax bracket, the tIRA is more valuable than to a person in a higher tax bracket, but the point is still valid. True, your tax rate can and probably will change over time. In the current situation, however, I'm suggesting that paying the taxes now simply recognizes and equalizes the difference (now). You can choose to call it a "cost" and consider the outlay as increasing your WR. But, in fact, your assets at the time of paying the taxes are (for all intents) exactly the same. Again, that might change over time based on tax brackets, but for now, you haven't changed your total assets by paying the taxes. I think that makes a (debatable) case for saying you haven't "spent" anything.

Please, never ask Koolau for the time. He is likely to explain how they make the watch.:angel:
 
FWIW, I count taxes paid for a Roth conversion as expenses and hence as part of the WR for the year.
 
...(snip)...
Please, never ask Koolau for the time. He is likely to explain how they make the watch.:angel:
Regarding that time, don't forget relativity theory. :)

I think retirees who are not filthy rich struggle a bit with that withdrawal yearly rate guilt. What about that new roof, or that replacement car? Do I really have to record it in spending immediately? How about maybe another bookkeeping method.

In reality retirement you have those ups and downs in yearly withdrawals. Tomorrow I'm going into see the dentist because apparently I'm grinding my teeth a bit in my sleep. Last year's financials has something to do with that.

I use the same method for those big expenses as I did when I was working, I either save for them, or "borrow" money and pay it back. My WR is calculated on the savings set aside for retirement. I have cash savings outside of that pot that I use to smooth the ups and downs of expenses which are not consistent year to year.

There are probably as many methods of managing your money in retirement as there are retirees. Choose one that works for you.
 
I am in awe of your accomplishments!! :D But hey, I'm getting there - - I don't do so well with change, so I'm taking it slowly but it will happen.

Then, with my luck the Dow will fall to 150 and stay there for 25 years. :rolleyes:
We hope the Dow doesn't fall to 150 but that is all most of us got. It is still the only game in town that might work. Even though the Dow went nowhere from 2000-2010 those of us who stayed invested still had gains from dividends. We live in interesting times. I would say the next 10 years will be better.
 
In another thread, I posted how my portfolio has been doing the last decade, but as I still have substantial income from part-time work, the result is not directly comparable to what other posters show here. I will say that these have been excellent results.

But, but, but I am sure this is another case of survivorship bias. Early retirees who ran into trouble would have left this forum and would not be posting here. Surely, some might be suffering hardship if they started out undercapitalized, but I couldn't help thinking some might have panicked and bailed out of the market at the bottom in early 2009. It was a tough time.

One of the reasons I was able to hang on was because I did lighten up early on equities when the loss was not as severe. Another important reason was that I resumed some part-time work, starting in late 2008, and that income surely helped my confidence to hang on, although in dollar amount, it was minuscule compared to the damage to the portfolio.

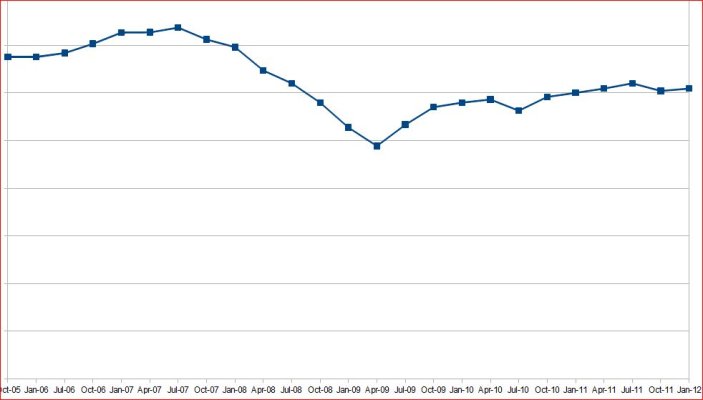
That brings me to the next observation. One quick look showed me that most people suffered something like 30%, or more, from Jan 2008 to Jan 2009. That's a lot more than Wellesley, which dropped only 10% in that period. In fact, even from the top of market to the bottom, meaning Oct 07 to Apr 09, Wellesley only dropped 22%.

So, what were all of you doin'? It would be nice if people put down a brief description of their investment method, along with the results. Something like, "I sliced-and-diced", or perhaps even "besides Wellesley as the main component, I had quite a bit of this and of that". But purely Wellesley, I have not seen.


1. But... but... did you pay off your mortgage?
2. Have you seen Raddr's update of his hapless hypothetical Y2K ER?
Raddr's Early Retirement and Financial Strategy Board • View topic - Hypothetical Y2K retiree update

I am not familiar with that forum, but the bleak result caught my eye. So, I went to the top of that thread, and learned that would be the result of someone with 75% stock/ 25% bond and a religious rebalancing regime. Ouch! The last decade was not one for stocks, that for sure.
 
Last edited:
That brings me to the next observation. One quick look showed me that most people suffered something like 30%, or more, from Jan 2008 to Jan 2009. That's a lot more than Wellesley, which dropped only 10% in that period. In fact, even from the top of market to the bottom, meaning Oct 07 to Apr 09, Wellesley only dropped 22%.

So, what were all of you doin'? It would be nice if people put down a brief description of their investment method, along with the results. Something like, "I sliced-and-diced", or perhaps even "besides Wellesley as the main component, I had quite a bit of this and of that". But purely Wellesley, I have not seen.

At the time, well over 50% of my stash was in a GIF. The dividend (or whatever you call the gain in a GIF) began to drop, but, never goes to zero. Other more or less fixed income investments (e.g., SPDAs) got their guaranteed payout (4% or higher as they were older). My main losses were my limited commitment to stock in MF (including Wellesley/Wellington) plus my old Megacorp. But my PMs MORE than made up the losses. So, though I did not track results very closely, a back of the envelope report card for the period of 07 to date shows no yearly losses even with 3% WDR. Neither was there a significant gain during that period. Sort of a flat line with a possible upward tilt. Since I have been converting to more MFs of late, I suspect my year end would be down very slightly. Haven't gone through my Vanguard statements yet. I know PMs are down from recent highs but still up for the year.

Obviously, my port. isn't for those wishing a 4% SWR. I like stability more than an ability to withdraw a higher SWR over time. YMMV
 
That brings me to the next observation. One quick look showed me that most people suffered something like 30%, or more, from Jan 2008 to Jan 2009. That's a lot more than Wellesley, which dropped only 10% in that period. In fact, even from the top of market to the bottom, meaning Oct 07 to Apr 09, Wellesley only dropped 22%.

So, what were all of you doin'? It would be nice if people put down a brief description of their investment method, along with the results. Something like, "I sliced-and-diced", or perhaps even "besides Wellesley as the main component, I had quite a bit of this and of that". But purely Wellesley, I have not seen.

IRR that year was -16.25%. AA was 40/50/10

I was very lucky in that I was still working at the peak of my earnings capacity with no kids on the books, or mortgage, and saving like crazy so I kept on putting money into 401k and after tax IRA's and other savings in the same AA ratio as before.

In 2008 I contributed $79.4k, and in 2009 $77.5k, then I retired on schedule in 2010. If the losses had continued at a high rate then I would have considered one more year working.

AA now is 35/55/10.
 
That brings me to the next observation. One quick look showed me that most people suffered something like 30%, or more, from Jan 2008 to Jan 2009. That's a lot more than Wellesley, which dropped only 10% in that period. In fact, even from the top of market to the bottom, meaning Oct 07 to Apr 09, Wellesley only dropped 22%.

So, what were all of you doin'? It would be nice if people put down a brief description of their investment method, along with the results. Something like, "I sliced-and-diced", or perhaps even "besides Wellesley as the main component, I had quite a bit of this and of that". But purely Wellesley, I have not seen.
That would be me, with a 29% decline. What did I do? I spent an inordinate amount of time searching for the ideal asset allocation, making sure I was well diversified but also exposed to all the right asset classes. I couldn't to count the time I spent doing that, or reading about asset allocation and portfolio diversification. It was a great learning experience, though.
 
That brings me to the next observation. One quick look showed me that most people suffered something like 30%, or more, from Jan 2008 to Jan 2009. That's a lot more than Wellesley, which dropped only 10% in that period. In fact, even from the top of market to the bottom, meaning Oct 07 to Apr 09, Wellesley only dropped 22%.

So, what were all of you doin'? It would be nice if people put down a brief description of their investment method, along with the results. Something like, "I sliced-and-diced", or perhaps even "besides Wellesley as the main component, I had quite a bit of this and of that". But purely Wellesley, I have not seen.

The devil is in the details.

I had an AA at the time of roughly 45/45/10. Wellesley (22% loss) and Dodge & Cox Balanced (55% loss) were the two main components.

I posted somewhere that my portfolio declined 38% at the market low in April 2009. That decline was due to both the drop in value of my investments and the withdrawals to pay our living expenses - we had no SS or other income source at the time.

Never bothered to run the numbers to see what the drop would have been without those withdrawals, but it would have obviously been considerably less.

Oh, and to provide a direct response to "So, what were all of you doin'?": Changing my underwear. Frequently.
 
Last edited:
That brings me to the next observation. One quick look showed me that most people suffered something like 30%, or more, from Jan 2008 to Jan 2009. That's a lot more than Wellesley, which dropped only 10% in that period. In fact, even from the top of market to the bottom, meaning Oct 07 to Apr 09, Wellesley only dropped 22%.

So, what were all of you doin'? It would be nice if people put down a brief description of their investment method, along with the results. Something like, "I sliced-and-diced", or perhaps even "besides Wellesley as the main component, I had quite a bit of this and of that". But purely Wellesley, I have not seen.

My IRR that year was ~-30%. 60% equities/40% fixed mostly VG Total Bond, Total Stock
 
A lot of my bonds were TIPS in 2008. Unfortunately they experienced a temporary decline due to lack of liquidity in the market. Had something to do with institutional panic and selling at any price. So the TIPS didn't balance out the portfolio a bit like nominals would have. Lessons learned.

We also found out that in a crash all equities tend towards a correlation of 1. Also we found out that we still had to spend money for living.

BTW, Wellesley didn't have all those problems.
 
Well after reading this thread I used Firecalc a few more times and I have to agree the text is the main point. The graph to me is not that important since I am 100% cash, CDs, munis or equivalent - all I need is one line - but those with a different asset allocation may need a broad visual confirmation of different outcomes.
The graph is not supposed to be the focus, the text summary above it is the point. And for folks with a technical interest, the graph gives a broad visual confirmation.
 
Last edited:
bold mine:
Well after reading this thread I used Firecalc a few more times and I have to agree the text is the main point. The graph to me is not that important since I am 100% cash, CDs, munis or equivalent - all I need is one line - but those with a different asset allocation may need a broad visual confirmation of different outcomes.

I don't think you understand the graph. The different lines are not the outcomes of different investments, they represent the outcomes of your selected AA, income and spending against different time periods.

The lines will vary with all fixed investments, as the real returns (return minus inflation) of those investments vary from year-to-year.

[edit/add]: So I ran the standard 30 year/ 4% WR on FIRECALC, and of course you get the ~ 95% success with 75% Equities. If I go to the 'portfolio' tab, and change to any of the 'fixed income' choices, with 0% equities, the success rate drops to ~ 40~50%.

I believe you are underestimating the effects of inflation, and putting too strong of an association with 'stable' and 'safe'.


-ERD50
 
Last edited:
ERD50 said:
I believe you are underestimating the effects of inflation, and putting too strong of an association with 'stable' and 'safe'.

Absolutely, to be 100% cash/CDs you'd need a huge excess (aka super low WR). Being 100% cash is much safer in the short-term, and much riskier in the long term.

Still, FIRECalc having the effects of inflation programmed in makes it useful for the 100% cash comparison, just set equities at 0% and keep upping the portfolio amount until you get a reasonable (depending on your own definition of "reasonable") success rate.

It will be a much higher amount than if you were willing to "risk" some in equities, but everyone has their own path.
 
Point taken, ERD50. Let me think more about it. Again, my financial skills are very poor, not my forte. I may miss something about the graph.
bold mine:


I don't think you understand the graph. The different lines are not the outcomes of different investments, they represent the outcomes of your selected AA, income and spending against different time periods.

(..)I believe you are underestimating the effects of inflation, and putting too strong of an association with 'stable' and 'safe'.


-ERD50
 
Last edited:
This year-old thread on real-world experience with of withdrawal rates had a good initial response so with another year gone by I'm updating my information. After retiring in mid 2005 our WR in 2012 fell below 4% for the first time:

2006 - 4.9% (portfolio withdrawals were sole source of income)
2007 - 9.8% (portfolio withdrawals were sole source of income)
2008 - 7.9% (portfolio withdrawals were sole source of income)
2009 - 6.1% (I began receiving SS benefits in Feb.)
2010 - 5.4% (DW began receiving SS benefits in May)
2011 - 4.2%
2012 - 3.9% (I went on Medicare)
2013 - 3.4% (projected - DW will move from high risk pool to Medicare and begin receiving a small non-COLA pension)
2014 - 3.2% (projected)

Note: All percentages are based on the initial portfolio value.

Below is how my portfolio value line is tracking along the FIRECalc spaghetti chart. So far, so good.
 

Attachments

  • 2012.JPG
    2012.JPG
    53.7 KB · Views: 35
Outstanding! Nice graph. Now that your SS and Medicare have kicked in, you can probably keep spending down at a sustainable amount, like 4% or so.

Also I notice you spent exactly what you projected in 2012. That's great! :)
 
Last edited:
I've just come to the end of my 3rd year, and my situation is non-COLA pensions supplying 70% of target spending on year 1.

My WR so far:

2010 0.0% - unexpected bonus from 2009 work
2011 1.14%
2012 1.33%
2013 2.16% - projected

Edit to add:
The % is from year end balance, not from initial balance at ER.
 
Last edited:
Back
Top Bottom