Join Early Retirement Today
Reply
 
Thread Tools Search this Thread Display Modes
dory36: old vs. new firecalc results?
Old 05-22-2006, 12:33 AM   #1
Dryer sheet aficionado
 
Join Date: Jan 2006
Posts: 27
dory36: old vs. new firecalc results?

Using the new firecalc, I am getting results that are consistently different (much less encouraging) than those from the old calculator.

The same exact scenario that was "100% safe" with the old firecalc calculator is now only "92.5% safe" in this new firecalc calculator.

Is the new calculator more conservative?* *Have other users noticed this difference?
I think I saw a post by Dory36 that mentioned that the new firecalc provides lower results than the old one.* *Is this true?* *Has anyone else noticed this effect?

If so, could someone (dory26, if possible) explain why this is the case?* *How is the new firecalc less "optimistic" than the original version?* *What different assumptions does the new version make?* Is there any way to counteract this effect?* *

Is the new firecalc still a work in progress that may eventually provide results that are more similar to those that the old firecalc provided for the same data?* *Or am I just doing something wrong?

Thanks for your reply(s)

halo is offline   Reply With Quote
Join the #1 Early Retirement and Financial Independence Forum Today - It's Totally Free!

Are you planning to be financially independent as early as possible so you can live life on your own terms? Discuss successful investing strategies, asset allocation models, tax strategies and other related topics in our online forum community. Our members range from young folks just starting their journey to financial independence, military retirees and even multimillionaires. No matter where you fit in you'll find that Early-Retirement.org is a great community to join. Best of all it's totally FREE!

You are currently viewing our boards as a guest so you have limited access to our community. Please take the time to register and you will gain a lot of great new features including; the ability to participate in discussions, network with our members, see fewer ads, upload photographs, create a retirement blog, send private messages and so much, much more!

Re: dory36: old vs. new firecalc results?
Old 05-22-2006, 02:59 AM   #2
Thinks s/he gets paid by the post
wabmester's Avatar
 
Join Date: Dec 2003
Posts: 4,459
Re: dory36: old vs. new firecalc results?

Along the same lines, did the link to the old version disappear? It'd be nice to compare the two versions for a while.

I got some odd results, but I can't compare to the original version to validate them. Also, didn't the old version have a TIPS option? I can't find that anymore.
wabmester is offline   Reply With Quote
Re: dory36: old vs. new firecalc results?
Old 05-22-2006, 06:26 AM   #3
Early-Retirement.org Founder
Developer of FIRECalc
dory36's Avatar
 
Join Date: Jun 2002
Posts: 1,840
Re: dory36: old vs. new firecalc results?

Hi Halo,

Yes, the new one is somewhat more conservative than the old one, for the reasons below.

Keep in mind that if you have used the (new or old) program to find a 100% safe rate, then by definition you have a solution that is hard against the edge of failure for at least 1 cycle. So anything that changes -- including the addition of 2003-2005 data that weren't yet available in the old version-- could push that one on the edge across to failure.

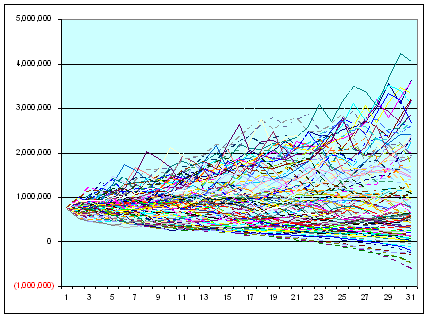
A failure by a penny the very last year of the cycle is treated the same as a massive failure, so look at the chart on the right in the standard run to see if the failures you are seeing are nearly zero, or are bigger.

Also, you might find the following useful in understanding the differences, especially those that could push a scenario that was successful by a dollar before to a failure by a dollar now:
_________________________________________________
First, from the change notes at http://firecalc.com/notes.htm (linked at the bottom of the FAQ):
... don't look for it to match exactly the results from the original, although it will be close. The algorithm is basically the same, but was redeveloped from scratch, and uses newer data and different default settings.
_________________________________________________
I no longer include partial "cycles" since 20-30 cycles that aren't the full x years will paint a falsely optimistic picture.
_________________________________________________
Current year withdrawals are taken at the beginning of the year, but since they will be used to meet currrent year expenses, they are adjusted for the actual inflation in the current year. (Note: I think this may be the biggest impact for you. If you are taking 50k and growth averages 8% and inflation averages 5%, then the program is withdrawing $2500 more to provide you with the spending money you'll need for the year (as did the old version), but you're no longer getting the 8% growth on the $52,500k ($4,200).

Workaround: FIRECalc assumes you really mean you need to be able to spend every bit of that $50,000 you entered as a spending requirement, every single year for the duration of your retirement.

If you are more flexible in your spending, then the optional spending model (shown near the top in the Advanced version) makes more sense. It allows fluctuations in spending, based on portfolio value, and is almost impervious to a failure in the standard FIRECalc sense. (It's idea of failure is your portfolio ends up being worth less than when you started.) Or as stated in the FAQ:
Quote:
FIRECalc seeks to answer the question, "With what I have today, and what it costs me to live, can I retire and maintain the same lifestyle?" So it works with today's portfolio. Since your lifestyle costs will change with inflation, the future withdrawals are adjusted accordingly, and FIRECalc tells you how often such a withdrawal plan would have worked.

But planning is different than practice. In Work Less, Live More, author Bob Clyatt points out that most people will adjust their spending in response to the value of their nest egg. If you choose, FIRECalc will base withdrawals on the portfolio value at the time of each annual withdrawal, instead of the starting portfolio.
_________________________________________________
FIRECalc has data through 2005. (This means full 40 year cycles starting in 1962-1965 started being considered in the process, or full 30 year cycles starting in 1972-75. Those were some lousy years, and would also make things look a bit worse for your model.)
_________________________________________________
Also, let me repeat a few responses that I wrote during the beta test:
_________________________________________________
Old system: withdrawal taken at end of year, and was adjusted for inflation, but the portfolio grew with the $$$ still in there the whole year.

New system (and thinking behind it): Your spending will be adjusted for inflation during the year, as prices will rise as you go along. But you'll withdraw the cash at the beginning of the year, because you can't eat air for 12 months waiting for the withdrawal.

Neither is really true -- you spend as you go -- but the granularity is in years, and I had to pick.
_________________________________________________
A bigger change in data. As did others who research this sort of data, I've switched to the long interest rate, which more closely approximates what people earn on the fixed portion of their portfolio, instead of commercial paper, which is more applicable to institutions than mere mortals.

The new data is much more stable, but it will also make your results change from the old data. (Look at the differences graphically at http://firecalc.com/faq.htm#fixedchoice.)
_________________________________________________
Hope this helps explain...

dory36
__________________
Often uninformed, seldom undecided.

Twenty years from now you will be more disappointed by the things you didn't do than by the ones you did do. So throw off the bowlines. Sail away from the safe harbor. Catch the trade winds in your sails. Explore. Dream. Discover. Mark Twain
dory36 is offline   Reply With Quote
Re: dory36: old vs. new firecalc results?
Old 05-22-2006, 07:09 AM   #4
Early-Retirement.org Founder
Developer of FIRECalc
dory36's Avatar
 
Join Date: Jun 2002
Posts: 1,840
Re: dory36: old vs. new firecalc results?

Quote:
Originally Posted by wab
Along the same lines, did the link to the old version disappear?* *It'd be nice to compare the two versions for a while.

I got some odd results, but I can't compare to the original version to validate them.* *Also, didn't the old version have a TIPS option?* *I can't find that anymore.
The old one is essentially gone. If you have an overwhelming need to run one last model through* it, PM me and I'll give you a link to a place you can run it until the rent runs out on that account.

By the way, in addition to differences cited in my previous response in this thread, the old one used commercial paper before* the Treasuries existed (the 1920s and the 1950s). The new one uses a blend that better matches the behavior -- see the faq page for a graph with these sets shown.

TIPS: I looked for the link where I discussed it and can't find it -- maybe it was in a PM during the hundreds of messages exchanged during the beta test.*

Anyway, I dropped TIPS because I wasn't comfortable with how to simulate TIPS when they didn't exist, or with how users were using them in the old version.

The simulation involved assuming these investments were available for ~120 years that they weren't, and assuming that if they were, they would have behaved the way they do today. In the old version, TIPS had to be simulated using the very volatile commercial paper (see graph), as did treasury investments -- that's all that I had at the time. I am not comfortable that we have enough data to accurately simulate TIPS. (I also have a vague discomfort with the idea of injecting a different type of investment that didn't exist in the past, and assuming it would have no effect on the behavior of the other investment types.* Assuming air cargo was an option in the 1800s without also assuming that railroad cargo rates would have been affected is perhaps TOO extreme an analogy, but perhaps it makes the point.)

One component of TIPS is the coupon above inflation. This is needed for any calculation, but can only be known at or around the time they are purchased. Since FIRECalc is normally used at times other than the moment of retirement, this called for people to have to guess at a coupon, with no basis for doing so. Usually people just accepted the default (which was nothing more than what the coupon was at the time the old version was written).* This "GIGO" situation made me very uncomfortable.

dory36
__________________
Often uninformed, seldom undecided.

Twenty years from now you will be more disappointed by the things you didn't do than by the ones you did do. So throw off the bowlines. Sail away from the safe harbor. Catch the trade winds in your sails. Explore. Dream. Discover. Mark Twain
dory36 is offline   Reply With Quote
Re: dory36: old vs. new firecalc results?
Old 05-22-2006, 08:43 AM   #5
Recycles dryer sheets
 
Join Date: Apr 2006
Posts: 190
Re: dory36: old vs. new firecalc results?

Quote:
Using the new firecalc, I am getting results that are consistently different (much less encouraging) than those from the old calculator.
The operative word here, per my own observations, is "much". The differences I've observed in results new vs old were not a matter of being on the edge by a single dollar and thus losing 100% success results. The differences seem pretty big.

For the conditions I examined (which seemed pretty typical to me -- 30 yrs, modest SS input in 11 years) I was observing an SWR difference of 0.5% to an entire 1% to yield the same successful cycles (of 30 yrs). I was using TIPS -- and I recall not using them as a test on the old system. They were worth about 0.2% SWR alone. But that still left a lot of variance to explain.

Quote:
Current year withdrawals are taken at the beginning of the year, but since they will be used to meet currrent year expenses, they are adjusted for the actual inflation in the current year. (Note: I think this may be the biggest impact for you. If you are taking 50k and growth averages 8% and inflation averages 5%, then the program is withdrawing $2500 more to provide you with the spending money you'll need for the year (as did the old version), but you're no longer getting the 8% growth on the $52,500k ($4,200).
My withdrawls were 40ishK and I'm sure this effect explained some variance old vs new, but maybe not the bulk.

BTW, I suggest the correct way to address this is not to deny all growth for the year. Since the money is extracted monthly for spending, you have an algorithmically accurate 1/2 of it available to grow on average. If someone is spending 40K, you should go ahead and spend 40K inflation adjusted, but only 20K of it should be denied growth. On average over the course of a year, 1/2 of the money is still in an account somewhere growing. This solves your granularity issue. It's like asking the average speed of a car that starts at zero mph and finishes at 60 mph 5 seconds later. It's 30 mph. Not the median, the average.

Quote:
I no longer include partial "cycles" since 20-30 cycles that aren't the full x years will paint a falsely optimistic picture.
I suspect this is the bulk of the variance old vs new. For a 30 year run, the market behavior from 1975 to 2005 is no longer available. That excludes the boom years of the 80's and 90's. The bad years of the early 70's are still there.

I don't know if I agree that inclusion of actual historical years, even if not a complete 30 yr cycle, was "falsely" optimistic. I understand the motivation, but to a minor extent it is negative data mining. And please understand this is not criticism -- because I don't have an opinion yet on whether or not the desire to exclude complete cycles should trump data mining. Maybe it should. You made a reasoned choice and maybe it's right.

It is possible that this is the bulk of the difference in observed results. The only way to test would be inclusion vs exclusion. Another point . . . compounding. The growth curve for any exponential has a characteristic shape where the slope of the curve at it's rightmost end becomes more and more vertical. Regardless of the 80s and 90's being boom years, excluding the later years of an exponential process will always data mine the lower slope portion of such a curve.

I don't know if it should.
modlair is offline   Reply With Quote
Re: dory36: old vs. new firecalc results?
Old 05-22-2006, 11:17 AM   #6
Early-Retirement.org Founder
Developer of FIRECalc
dory36's Avatar
 
Join Date: Jun 2002
Posts: 1,840
Re: dory36: old vs. new firecalc results?

Let me try to clarify a bit of this, and offer an example or two.

If you take $40,000 from a $1 million portfolio, using the defaults, you get a 94.3% success rate.

The $40,000 is assumed to be taken at the beginning of the year. The old version assumed the end of the year, so it would have added, assuming an 8% average growth rate, $3200 to the total before the withdrawal was made.

If we undo that effect for the current version, and subtract the $3200 so we try a withdrawal of $36,600, the success rate is 99.1%. While that seems like a big swing, it's just capturing programmatically what was described in the instructions of the old version, telling people that they needed to start with the spending money for their first year outside the portfolio. (Here's what those instructions said: Withdrawals are calculated as of the end of each year, so interest, dividends, and growth continue to be applied until then. This means the first withdrawal will not take place until up to a year after you begin retirement, if you retire early in the year.)

I am not sure I agree that it would be better to show withdrawals monthly or semi-annually, especially for early retirees. At least for many of us, the IRS rules regarding SEPPs make us take it all out in January. Sure, we can reinvest it, but will we do so in something that matches the way the rest of the portfolio behaves? Certainly not in my case, anyway. Short CDs and money markets provided about enough growth to cover the gas it took to get to the bank and get the stuff arranged!* Not having an unambiguous growth rate to apply to the withdrawn funds, I elected to treat the withdrawals annually, just as did the old version, and allow the user to decide how to handle what happens to assets that have been removed from the portfolio.


Re the exclusion of partial periods -- you rightly point out that this excludes some boom years, while catching the bad years before 1975 (for a 30 year cycle).

But since FIRECalc is a worst-case tool, leaving out partial cycles that included these additional good years doesn't affect the outcome except by incrementing both the numerator and the denominator of the success rate, so a 75/100 success rate becomes a 76/101 success rate.* Only if the partial periods were failures would they have a meaningful impact (and thereby make the results of the new version more conservative still). As is discussed in another thread, I tested a large number of scenarios looking for a realistic case where the addition of the partial periods would add to the failure rate, and was unable to find any. No one else could identify any such case.

So in effect, all the elimination of the partial periods did was to subtract 30 from each the numerator and the denominator, so the results reported in the default settings are 100 successful cycles out of 106 total, or 94.3% success rate, rather than 100 full plus 30 successful partial cycles divided by 136 total, or 95.6%.


Some folks love to look at this kind of stuff, and there's nothing wrong with that, but for most of us, there is a danger in trying to look at the smallest details so closely that we miss the big picture. (Or, as I said in the "background" section, "...don't fall into the trap of measuring something with a micrometer when you'll be cutting it with an axe.")

The person contemplating early retirement wonders whether his money will last 30 years. FIRECalc offers a feasibility test looking at historical results and says, "Based on what you've entered, your nest egg will likely end up somewhere between top and bottom lines at the right of the chart below. If you're willing to take that risk, or to tighten your belt a little when times are tough, then go for it. Wanna be safer? Start with a little more or take out a little less, and you can move the whole tangled mess of lines up enough so that the bottom ones don't cross zero."


__________________
Often uninformed, seldom undecided.

Twenty years from now you will be more disappointed by the things you didn't do than by the ones you did do. So throw off the bowlines. Sail away from the safe harbor. Catch the trade winds in your sails. Explore. Dream. Discover. Mark Twain
dory36 is offline   Reply With Quote
Re: dory36: old vs. new firecalc results?
Old 05-22-2006, 03:11 PM   #7
Thinks s/he gets paid by the post
wabmester's Avatar
 
Join Date: Dec 2003
Posts: 4,459
Re: dory36: old vs. new firecalc results?

I've only played with the new calc a little bit, but I get some odd results (which is why I wanted to play with the old one to compare).

Ask firecalc to find the 95% success rate for:

30 years
0% inflation
0% expense ratio
100% FI
start data at 1927

then switch between the first option (total market) and select 30-year treasuries
and the second option (mixed port) and select 100% LT treasuries

I would have expected them to be pretty much identical, but the first gives you 4.70% and the second gives you 4.07%.
wabmester is offline   Reply With Quote
Re: dory36: old vs. new firecalc results?
Old 05-22-2006, 03:46 PM   #8
Dryer sheet aficionado
 
Join Date: Jan 2006
Posts: 27
Re: dory36: old vs. new firecalc results?

To be more specific:

The old firecalc gave me a "100% safe" withdrawal of $162K annually, and, when I enter exactly the same parameter values into the new firecalc, it says that only $142K annually is a "100% safe" annual withdrawal.* That's a difference of $20K per year, or around 14% more or less spending either way.*

To my way of thinking, that's a really significant difference.* *Dory36 explains it could stem from his not including partial cycles and/or taking out living cash at the end vs. the beginning of a calendar year.* But this 14% difference in spending seems to be way too big to result only from these factors, especially considering dory36's recent explanation that they should result in much smaller, slighter differences.

There seems to be something more fundamental wrong here.* *What could it be?
Are there any other explanations for why I'm getting such a large difference in "100% safe" spending results between the old and new firecalcs using exactly the same parameters?

Any and all information about this issue is greatly appreciated.* I think it's important and I'd really like to get to the bottom of this.

Thanks.
halo is offline   Reply With Quote
Re: dory36: old vs. new firecalc results?
Old 05-22-2006, 03:57 PM   #9
Early-Retirement.org Founder
Developer of FIRECalc
dory36's Avatar
 
Join Date: Jun 2002
Posts: 1,840
Re: dory36: old vs. new firecalc results?

Simple answer . . . the data for the two sets are from different sources. *The data used for the total market is from Dr. Shiller's studies, and is rounded to two decimal places. The data used for the mixed portfolio is from research contracted for use by ESRBob for his book, and is rounded to 1 decimal place.

ESRBob and I discussed it when we noticed slight discrepancies, and determined that where the data I used in the old and new versions of FIRECalc was based on each year's January snapshot, his was based on mid-year data. *Because of that, the data were kept separate so you use one set or the other.
__________________
Often uninformed, seldom undecided.

Twenty years from now you will be more disappointed by the things you didn't do than by the ones you did do. So throw off the bowlines. Sail away from the safe harbor. Catch the trade winds in your sails. Explore. Dream. Discover. Mark Twain
dory36 is offline   Reply With Quote
Re: dory36: old vs. new firecalc results?
Old 05-22-2006, 04:02 PM   #10
Recycles dryer sheets
 
Join Date: Apr 2006
Posts: 190
Re: dory36: old vs. new firecalc results?

Just a quick comment. That's a big withdrawl. As per Dory's comments, the bigger the withdrawl, the greater that start of year/end of year effect is going to be -- because 8% of 120K is a lot more money than 8% of a $40K withdrawl. Don't forget, that effect compounds over the 30 or 40 yrs.

Dory seems to feel (and he'd have tested with his simulation more than anyone) that this end vs start of year behavior is the decisive behavior in these large changes between old and new we are observing so given that sensitivity to withdrawl magnitude maybe it's not surprising.

I'm still scratching my head on the later cycles thing, but his arguments are pretty good and may be correct.

I think I would suggest, still, that the start of year extracted money get some kind of growth. Yes, money market funds are yielding very little, but it's an amount > 0 and if this is indeed the most sensitive parameter, small numbers may matter.

Wait, there was a post just as I posted this so I'm modifying it. If the data are different, all bets are off.
modlair is offline   Reply With Quote
Re: dory36: old vs. new firecalc results?
Old 05-22-2006, 04:29 PM   #11
Early-Retirement.org Founder
Developer of FIRECalc
dory36's Avatar
 
Join Date: Jun 2002
Posts: 1,840
Re: dory36: old vs. new firecalc results?

Quote:
Originally Posted by halo
To be more specific:

The old firecalc gave me a "100% safe" withdrawal of $162K annually, and, when I enter exactly the same parameter values into the new firecalc, it says that only $142K annually is a "100% safe" annual withdrawal.* That's a difference of $20K per year, or around 14% more or less spending either way.*

To my way of thinking, that's a really significant difference.* *Dory36 explains it could stem from his not including partial cycles and/or taking out living cash at the end vs. the beginning of a calendar year.* But this 14% difference in spending seems to be way too big to result only from these factors, especially considering dory36's recent explanation that they should result in much smaller, slighter differences.

There seems to be something more fundamental wrong here.* *What could it be?
Are there any other explanations for why I'm getting such a large difference in "100% safe" spending results between the old and new firecalcs using exactly the same parameters?

Any and all information about this issue is greatly appreciated.* I think it's important and I'd really like to get to the bottom of this.

Thanks.
Halo, perhaps I wasn't clear in my earlier answer to you, above, and probably provided too much info, to address many of the questions I have had during the beta testing. *

Sorry -- let me try again.

The $20,000 discrepancy you mention is 12% of $162,000.

If you check the long term returns of "the market", you'll see it is also 12%. See VFINX, for example, which has a 12% total return since inception. *DFA's large cap data shows 12%, and small cap is something over 14%.

Since the new version takes your money out at the beginning of the year, and the old one took it at the end, that $20,000 is simply the expected growth that would have been seen on that $162,000 had you not needed to take the money out to live on that year.

The old FIRECalc said in its instructions that your first year's living expenses needed to be from sources outside the portfolio you submitted to FIRECalc. If you followed that instruction, then there would be $162,000 sitting in a separate investment, outside the portfolio that FIRECalc was analyzing, that could have been earning that exact same $20,000.

(The reason for that was feedback received from a large number of people who tested that version, six years ago.)

Does this clear it up?

dory36
__________________
Often uninformed, seldom undecided.

Twenty years from now you will be more disappointed by the things you didn't do than by the ones you did do. So throw off the bowlines. Sail away from the safe harbor. Catch the trade winds in your sails. Explore. Dream. Discover. Mark Twain
dory36 is offline   Reply With Quote
Re: dory36: old vs. new firecalc results?
Old 05-22-2006, 04:35 PM   #12
Early-Retirement.org Founder
Developer of FIRECalc
dory36's Avatar
 
Join Date: Jun 2002
Posts: 1,840
Re: dory36: old vs. new firecalc results?

Quote:
Originally Posted by rodmail
I think I would suggest, still, that the start of year extracted money get some kind of growth.* Yes, money market funds are yielding very little, but it's an amount > 0 and if this is indeed the most sensitive parameter, small numbers may matter.
What growth rate would you use for the spending money withdrawn at the beginning of the year?
__________________
Often uninformed, seldom undecided.

Twenty years from now you will be more disappointed by the things you didn't do than by the ones you did do. So throw off the bowlines. Sail away from the safe harbor. Catch the trade winds in your sails. Explore. Dream. Discover. Mark Twain
dory36 is offline   Reply With Quote
Re: dory36: old vs. new firecalc results?
Old 05-22-2006, 05:18 PM   #13
Recycles dryer sheets
 
Join Date: Apr 2006
Posts: 190
Re: dory36: old vs. new firecalc results?

Quote:
I think I would suggest, still, that the start of year extracted money get some kind of growth. Yes, money market funds are yielding very little, but it's an amount > 0 and if this is indeed the most sensitive parameter, small numbers may matter.

What growth rate would you use for the spending money withdrawn at the beginning of the year?
I certainly don't want to be a bother.

But when you are dealing with a gradual diminishment of an asset, the correct model is a rate X 1/2 the total -- which will be the average amount compounded over the year.

The rate . . . we may have a disagreement here. It is not clear to me there is any algorithmic value to doing any special extraction at start of year. If you are rebalancing your asset mix on Dec 31, then perhaps you do your extraction monthly out of your primary portfolio using that mix.

Yes, I know people might not want to do that monthly. If they did, the correct rate would be that year's avg total portfolio return.

Maybe they do the extraction yearly -- as you imply. If they do, then the right compounding vehicle for 1/2 that yearly amount would be the shortest term vehicle available since 1871. Perhaps the 3 month T bill rate? If you found 5 yr maturity data back that far, one suspects an even shorter maturity historical database exists. Anyway, this would emulate some no doubt modest yearly additional money available.

Note that given this thread's information, I would no longer believe this effect will be substantial.
modlair is offline   Reply With Quote
Re: dory36: old vs. new firecalc results?
Old 05-22-2006, 05:40 PM   #14
Early-Retirement.org Founder
Developer of FIRECalc
dory36's Avatar
 
Join Date: Jun 2002
Posts: 1,840
Re: dory36: old vs. new firecalc results?

Hmmm... I follow, but I wonder. I'll look and see what data are available.

Part of my thinking comes from using myself as a test case. The early withdrawal goes out fast early in the year, for any annual costs (insurance, property taxes, etc), and I just treat the miniscule growth on the remainder as "bonus" money, not as a chunk that can be used to reduce the withdrawal amount. I might think differently if I was looking at $160k though.
__________________
Often uninformed, seldom undecided.

Twenty years from now you will be more disappointed by the things you didn't do than by the ones you did do. So throw off the bowlines. Sail away from the safe harbor. Catch the trade winds in your sails. Explore. Dream. Discover. Mark Twain
dory36 is offline   Reply With Quote
Re: dory36: old vs. new firecalc results?
Old 05-22-2006, 07:26 PM   #15
Recycles dryer sheets
 
Join Date: Apr 2006
Posts: 190
Re: dory36: old vs. new firecalc results?

Quote:
Hmmm... I follow, but I wonder. I'll look and see what data are available.

Part of my thinking comes from using myself as a test case. The early withdrawal goes out fast early in the year, for any annual costs (insurance, property taxes, etc), and I just treat the miniscule growth on the remainder as "bonus" money, not as a chunk that can be used to reduce the withdrawal amount. I might think differently if I was looking at $160k though.
Aha! That explains your perspective. You extract the upcoming year's expenses in January from your portfolio, and you pay a ton of annual bills in January the next day. In that situation, there's nothing left to compound other than food money and maybe utilities money -- unless you prepay those too somehow.

I was thinking food, rent, travel, utils, magazine subscriptions, toys, health care -- all of which might be doled out monthly. In a low rate environment, which we have had recently, prepaying doesn't hurt you. If someone is spending 100K in a decade and rates are 6% on short term money, then $3K/yr is flushed by prepaying expenses.

If you go with a way to grow your expense money during the year, you can still model your approach by letting the user set the short term rates to zero.

Don't know how sensitive results are to this. Apparently the most compelling difference in old vs new firecalc is not this and not the tossing of recent years, but rather different market data. That's just . . . scary that sampling mid year vs end of year can render a successful 5.5% SWR (with Soc Sec) into an abject failure even as low as 4.5%.
modlair is offline   Reply With Quote
Re: dory36: old vs. new firecalc results?
Old 05-22-2006, 07:41 PM   #16
Early-Retirement.org Founder
Developer of FIRECalc
dory36's Avatar
 
Join Date: Jun 2002
Posts: 1,840
Re: dory36: old vs. new firecalc results?

Quote:
Originally Posted by rodmail
...That's just . . . scary that sampling mid year vs end of year can render a successful 5.5% SWR (with Soc Sec) into an abject failure even as low as 4.5%.
The mid year stuff was just for wab's 4.7 vs 4.07 question, where he was using two different sources of 30 year bond info in the program. I should have quoted his question in my response.
__________________
Often uninformed, seldom undecided.

Twenty years from now you will be more disappointed by the things you didn't do than by the ones you did do. So throw off the bowlines. Sail away from the safe harbor. Catch the trade winds in your sails. Explore. Dream. Discover. Mark Twain
dory36 is offline   Reply With Quote
Re: dory36: old vs. new firecalc results?
Old 05-23-2006, 11:56 AM   #17
Recycles dryer sheets
 
Join Date: Apr 2006
Posts: 190
Re: dory36: old vs. new firecalc results?

Okay, at this point I'm confused.

There are numerous observations of somewhat significantly different results from old firecale vs new firecalc.

Have the variances been explained?

Causes suggested:

1) Early in year withdrawl for year's expenses and denial of the year's growth to that chunk of money in new vs old.

2) The new firecalc excludes later years from the analysis, past a year point where the user selected duration would not be fully populated. (BTW, re 75/100 success vs 105/130 success. That's 75% vs 80%. A not insignificant success % delta.)

3) TIPS are gone.

Do these items explain all the variance old vs new?

Personally, I think I was observing a change in SWR between 0.5 and 1.0% for a given success % level. Will these 3 items explain that much?
modlair is offline   Reply With Quote
Re: dory36: old vs. new firecalc results?
Old 05-23-2006, 12:09 PM   #18
Early-Retirement.org Founder
Developer of FIRECalc
dory36's Avatar
 
Join Date: Jun 2002
Posts: 1,840
Re: dory36: old vs. new firecalc results?

Quote:
Originally Posted by rodmail
Have the variances been explained?
Yes.
__________________
Often uninformed, seldom undecided.

Twenty years from now you will be more disappointed by the things you didn't do than by the ones you did do. So throw off the bowlines. Sail away from the safe harbor. Catch the trade winds in your sails. Explore. Dream. Discover. Mark Twain
dory36 is offline   Reply With Quote
Re: dory36: old vs. new firecalc results?
Old 05-23-2006, 12:25 PM   #19
Recycles dryer sheets
 
Join Date: Apr 2006
Posts: 190
Re: dory36: old vs. new firecalc results?

Quote:
Have the variances been explained?
Yes
Okie doke. That single Yes reassures the whole thing.

The only item that I'm not sure indicates old firecalc was too optimistic is the erasure of later years. But simply understanding that is probably enough.
modlair is offline   Reply With Quote
Re: dory36: old vs. new firecalc results?
Old 05-23-2006, 01:12 PM   #20
Dryer sheet aficionado
 
Join Date: Jan 2006
Posts: 27
Re: dory36: old vs. new firecalc results?

dory, could you give us a link to the old firecalc site
so we can do an A/B check of these variances?

That would really be helpful to be able to do some
direct comparisons between old and new firecalcs
before the rent runs out on the old firecalc site.

Thanks!
halo is offline   Reply With Quote
Reply


Currently Active Users Viewing This Thread: 1 (0 members and 1 guests)
 
Thread Tools Search this Thread
Search this Thread:

Advanced Search
Display Modes

Posting Rules
You may not post new threads
You may not post replies
You may not post attachments
You may not edit your posts

BB code is On
Smilies are On
[IMG] code is On
HTML code is Off
Trackbacks are Off
Pingbacks are Off
Refbacks are Off


Similar Threads
Thread Thread Starter Forum Replies Last Post
Firecalc slays a strawman, deceives many hankjoy FIRE and Money 46 11-30-2010 04:14 PM
FIRECalc special option results Lsbcal FIRE and Money 0 06-28-2006 04:54 PM
FIRECalc Results Chince Hi, I am... 4 09-11-2005 04:51 PM
Question for Dory36 on FIRECalc moguls FIRE and Money 24 03-06-2004 06:03 AM

» Quick Links

 
All times are GMT -6. The time now is 03:48 PM.
 
Powered by vBulletin® Version 3.8.8 Beta 1
Copyright ©2000 - 2023, vBulletin Solutions, Inc.