Boho
Thinks s/he gets paid by the post
- Joined
- Feb 7, 2017
- Messages
- 1,844
My portfolio page works again!
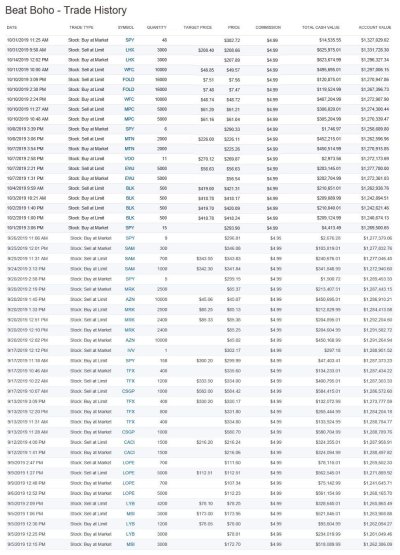
LHX: bought 3000 shares at $207.89 ($623,674.99), sold at $208.66 ($625,975.01), made $2300.02.
mar 29, 2017
spy adjusted close: $224.59
$1,000,000 / $224.59 = 4452 shares + $125.32 cash
oct 31, 2019
spy adjusted close: $303.33
$303.33 * 4452 shares = $1,350,425.16
$1,350,425.16 + $125.32 cash = $1,350,550.48
boho at close of oct. 31: $1,329,442.02
$1,350,550.48 (spy investor) - $1,329,442.02 (boho) = $21,108.46 (1.56%)
1.56% difference after 31 months = .05% difference per month
.05% x 12 = .6% average difference per year

....
.05% x 12 = .6% average difference per year
In case I wasn't clear, I'm behind $21,108.46 if my calculations were correct.
...
If you had invested $623,674.99 in VOO on 10/14 at $271.88 you could have sold it today for $638,975.51 (at $278.55) and made $15,300.52
this Rock-Paper-Scissors 'hunch"?
How many of my last 100 picks were losers? Zero? (maybe I haven't posted enough of my trading history). I essentially don't lose any more. ... .
... I essentially don't lose any more. Finding something that outperforms the index isn't always easy...
| Current Rank | Previous day's rank | Account Value (USD) | Today's change in value | Overall% |
| 1. comsecga | 1 | $3,217,412.41 | ($20,441.20) | 221.74% |
| 2. Spudd | 2 | $2,781,803.27 | ($15,375.09) | 178.18% |
| 3. kite_rider | 3 | $2,466,311.66 | $88,740.00 | 146.63% |
| 4. cfahey27 | 4 | $1,413,586.67 | $13,065.00 | 41.36% |
| 5. BohoII | 5 | $1,329,442.02 | ($1,352.03) | 32.94% |
| 6. wmc1000 | 6 | $1,281,612.62 | $16,491.99 | 28.16% |
| 7. lbymfreddie | 7 | $1,240,108.30 | $3,429.84 | 24.01% |
| 8. DieWurst | 8 | $1,210,352.83 | ($3,474.60) | 21.04% |
| 9. wrd58 | 10 | $1,177,152.14 | ($368.00) | 17.72% |
| 10. nvestysly | 9 | $1,172,519.70 | ($5,399.76) | 17.25% |
| 11. easysurfer | 11 | $1,142,334.67 | ($1,428.92) | 14.23% |
| 12. covert1 | 12 | $1,126,434.74 | ($7,720.00) | 12.64% |
| 13. KCScubaSteve | 13 | $1,074,969.67 | $1,553.75 | 7.50% |
| 14. RiskyBusinessC2 | 14 | $1,021,978.22 | $2,700.00 | 2.20% |
| 15. ransil | 15 | $1,001,668.31 | $611.80 | 0.17% |
| 16. dixonge | 16 | $1,000,000.00 | $0.00 | 0.00% |
| 17. exnavynuke | 17 | $1,000,000.00 | $0.00 | 0.00% |
| 18. jmil07 | 18 | $1,000,000.00 | $0.00 | 0.00% |
| 19. consvgmbl | 19 | $1,000,000.00 | $0.00 | 0.00% |
| 20. monitorLizzy | 20 | $1,000,000.00 | $0.00 | 0.00% |
| 21. secondcor521 | 21 | $1,000,000.00 | $0.00 | 0.00% |
| 22. guestperson | 22 | $998,905.01 | ($760.00) | -0.11% |
| 23. natetheb | 23 | $968,008.77 | $4,867.34 | -3.20% |
| 24. sengsational | 24 | $915,449.95 | ($13,392.90) | -8.46% |
| 25. lawrencewendall | 25 | $786,196.69 | $11,388.33 | -21.38% |
Invalid Trade: No Volume In Stock This order did not execute due to a violation of the game's volume rule. Every game has a setting that only allows an order to be executed when the size of the order is less than 10.00 % of the stock's real life trading volume. If this stock typically has high daily trade volume, try making this trade again at a later time in the day; as our data feed updates alongside the real world's trade volume.

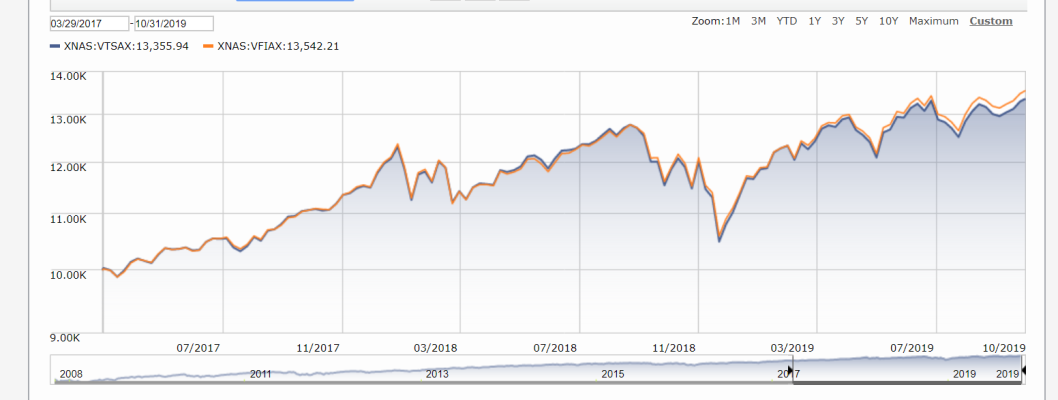
Total Stock Market (VTSMX): $1,335,594... 11.81% annualized return
Boho II: $1,329,442... 11.61% annualized return
I do want to compare against a few alternatives for index investors. I know some indexers think international stocks are unimportant but others don't.
S&P 500 (VFIAX): $1,354,221... 12.41% annualized return
Boho II: $1,329,442... 11.61% annualized return
....Your amount for S&P 500 is greater than what I figure it to be. Could someone check my work:
Mar 29, 2017
SPY adjusted close: $224.59
$1,000,000 / $224.59 = 4452 shares + $125.32 cash
Oct 31, 2019
SPY adjusted close: $303.33
$303.33 * 4452 shares = $1,350,425.16
$1,350,425.16 + $125.32 cash = $1,350,550.48
edit: I used the adjusted close for SPY on the first day of the contest, which was $224.59 but now I'm thinking that price was adjusted for dividends but someone buying on that day wouldn't be entitled, so the un-adjusted close would be the better price to use at the start of the contest. The un-adjusted close was higher ($235.54) so the indexer would get fewer shares to start and end up with a LOWER balance than I figured, not higher.
There needs to be a tutorial on this! People say "use the adjusted close" like that's a revelation, but they still have to say how to use it!
You're overthinking it.... forget the approach that you are taking.
Just go to VFIAX Vanguard 500 Index Fund Admiral Shares Fund VFIAX chart and then put in the dates.... in this case 3/29/17 to 10/31/19.... the result will be the growth of $10,000 with dividends reinvested.... then just multiply result by 100 since the initial investment is $1 million rather than $10,000.... in this case $13,542.21 * 100 = $1,354,221.
In fact, this approach arguably slightly understates the return since VFIAX includes a 0.04% expense ratio... probably by ~$1,000 or so.... but close enough.
... In fact, this approach arguably slightly understates the return since VFIAX includes a 0.04% expense ratio... probably by ~$1,000 or so.... but close enough.
It says "All data from Morningstar except U.S. intraday real-time exchange quotes, which are provided by BATS when available." I need a description of BATS that says their data is adjusted. It's either better or worse than the Yahoo adjusted data I've been using, or else I've been using Yahoo wrong. I still want to know how I'm supposed to use Yahoo. I'm trying to learn this stuff, I'm not just overthinking the contest. Maybe I'll start a new thread.
I gave examples of using yahoo adj prices. They match the morningstar numbers within some small rounding errors. You are barking up the wrong tree.
-ERD50
But a fund/ETF's total return includes the effect of expenses, right? So no adjustment should be made.
Unless you are trying to state what "the market" would do. But for me, the reality is that the alternative to stock picking is buying a fund/ETF. The concept of "the market" is just a concept. The reality of a tracking fund/ETF is very, very close to reality though. As you say, a cost of about 0.1% over ~ 2.5 years.
A small price to pay for all that time you get back, not having to read press releases, earning reports, etc. It's like being paid to nap!
-ERD50