Lsbcal
Give me a museum and I'll fill it. (Picasso) Give me a forum ...
I wanted to compare the decline from the November 2021 peak to previous recessionary market declines. It appears we are not currently in a recession but one could come about in future months. Unemployment is declining and should that reverse it would be very negative I think.
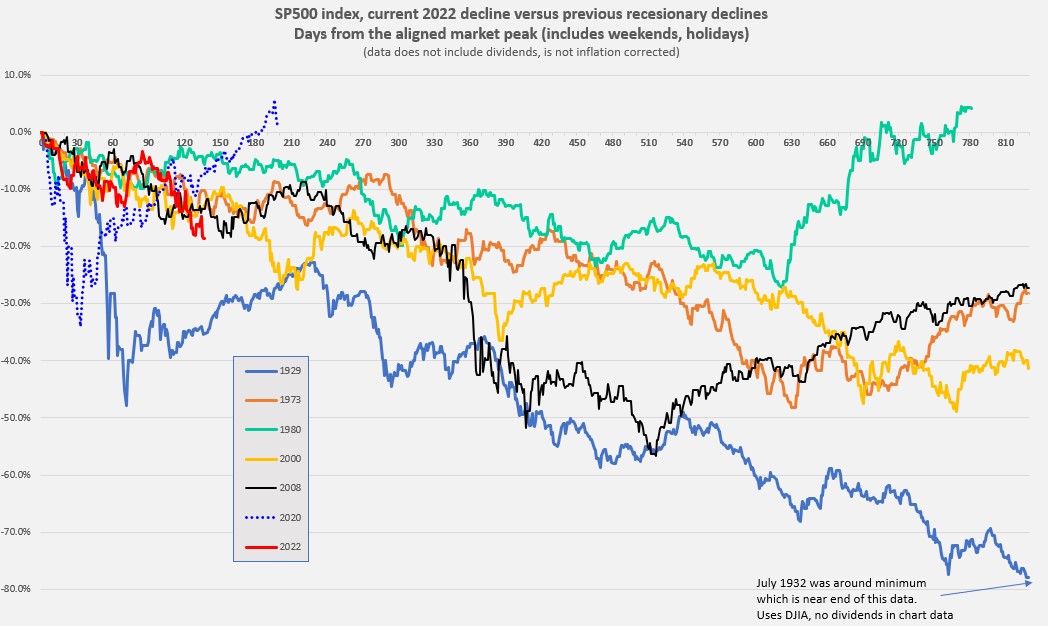
So I took daily data from several bad markets that included a recession and aligned the peaks. The Y-axis is days from the peak in calendar days (not trading days). The chart below shows where we are as of May 20, 2022 (red line). The SP500 is down -18.7% from the peak 97 days ago (not counting dividends). This is worse then all but the 1929 decline and the 2020 pandemic decline. The 1929 data is from the Dow Jones Industrial average and that period included deflation plus larger dividends then now.
Maybe we get a bounce up from here? Even in previous bad markets there were jagged rallies upwards. As usual, this is only historical and does not tell us what the future holds. Sorry about that .
.
If there is some interest, I will update this chart from time to time.
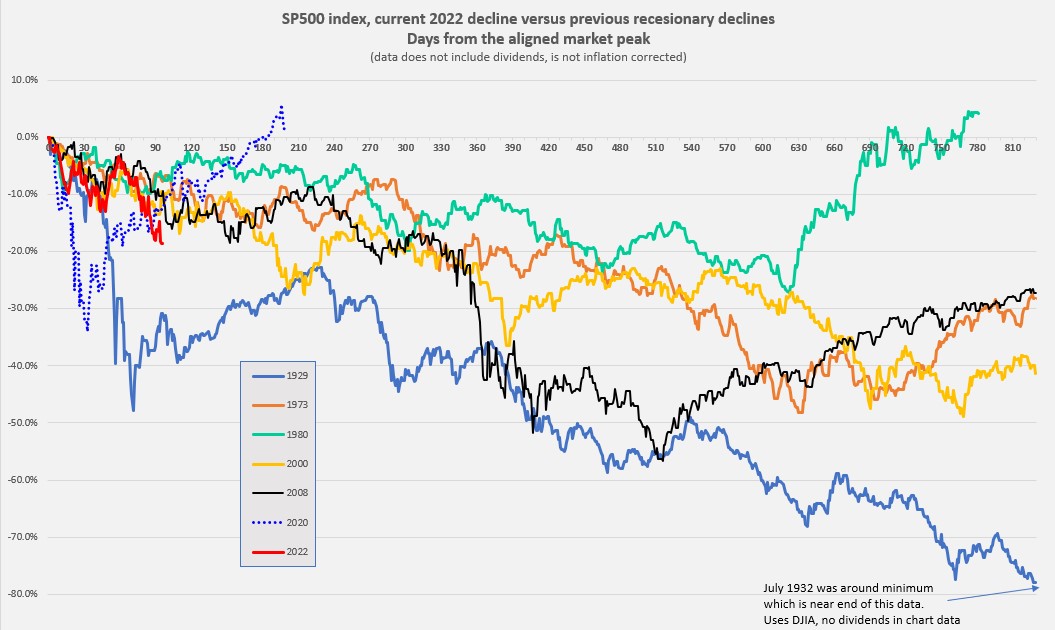
So I took daily data from several bad markets that included a recession and aligned the peaks. The Y-axis is days from the peak in calendar days (not trading days). The chart below shows where we are as of May 20, 2022 (red line). The SP500 is down -18.7% from the peak 97 days ago (not counting dividends). This is worse then all but the 1929 decline and the 2020 pandemic decline. The 1929 data is from the Dow Jones Industrial average and that period included deflation plus larger dividends then now.
Maybe we get a bounce up from here? Even in previous bad markets there were jagged rallies upwards. As usual, this is only historical and does not tell us what the future holds. Sorry about that
.If there is some interest, I will update this chart from time to time.
 .
.