"I lost $25K today"--Does it really feel like that?

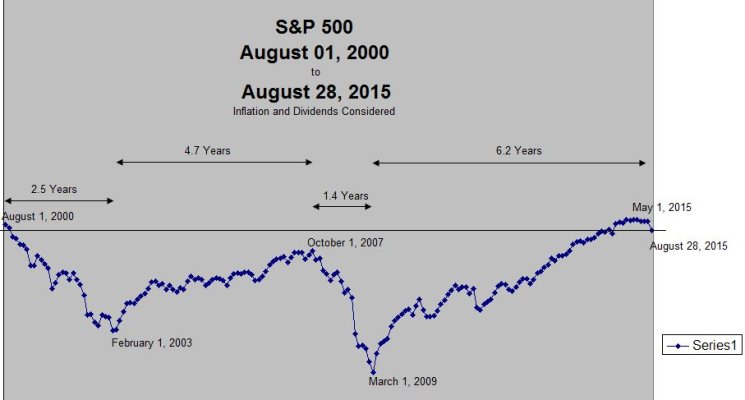
Those are the ones I'm insuring against by having 7 years to go without selling equities. When people say 2 years, I'm thinking "not nearly enough". Just looking at the S&P 500, with dividends, it looks like roughly 6.2 years from peak to above that old peak for the 2003, and 5.8 years peak to above that old peak for the 2008. And that doesn't count inflation. If you do, then it's 12.7 years from the 2000 peak to break-even. This is according to S&P 500 Return Calculator - Don't Quit Your Day Job... . I've almost talked myself into selling it all! Since August 2000 to May 2015, the return of the S&P 500 has been an inflation adjusted 2%! It's gone down 4.2% since May (only that figured does not including dividends). That's a lot of years to get back to "even". But the alternative was to lose buying power if you were in bonds instead.

I figure that as long as cash and fixed income cover 7 years of after-tax spending, I'm covered well enough. 4% x 7 years is 28% of portfolio in fixed income. And that case covers taxes too. My fixed income allocation is much higher than that, to that gives me room to buy stocks when down plus still have X years in living expenses not in stocks.

I do have a couple years cash outside the portfolio, but the other years are covered by cash plus bonds that is part of the portfolio AA.

As the portfolio appreciates and you rebalance, the fixed income portion increases in absolute terms. Then it's there for you when you have to make it through market down years.

If you rebalanced when the S&P was way down, you didn't have to wait as long for your portfolio to break even.
 
Where do you get the numbers that you put into firecalc.... not what comes out.

I just use what I get that day. That said, Firecalc works from the assumption that it is being used as of January 1. So my Firecalc numbers that I use are usually January 1 of the year in question with spending adjusted or toward the end of the year if I run it I project what it will be in the next January. As a practical matter, I mostly use the Firecalc numbers I get at the beginning of each year.
 
I just use what I get that day. That said, Firecalc works from the assumption that it is being used as of January 1. So my Firecalc numbers that I use are usually January 1 of the year in question with spending adjusted or toward the end of the year if I run it I project what it will be in the next January. As a practical matter, I mostly use the Firecalc numbers I get at the beginning of each year.

effectively mark to market. Thanks
 
I did not intend my question to be about how firecalc does its calculation and the validity of that. One puts in my dollar invested are $X... what ever X is .. say $1MM. So to get that $1MM to put into firecalc is that value just what your brokerage accounts say you have on a given day? Do you average over the brokerage numbers over some period of time (either literally or approximately) and use that number. Or do take the brokerage numbers and subtract out unrealized gains and add back in unrealized losses and use this number? Where do you get the numbers that you put into firecalc.... not what comes out.

bingybear, I apologize; that's what I get for trying to answer questions on the way out the door to w*rk...

Yes, really all you can do is to start with the market value you know, today.

For those that pointed out that Firecalc doesn't do what they consider to be real Monte Carlo, I'd just assert that using historical data to predict future performance is simply using a better draw. Typical MC models use draws based on statistical functions; e.g., the normal distribution of annual rates of return described by a mean and standard deviation. BTW, S&P500 history is mean ~10%, stdev ~18%. I believe the market has more complex behavior than that, so I appreciate Firecalc's use of historical data to provide more relevant rate-of-return sequences. However, the model approach is still monte carlo in the sense that using historical market patterns is just speculation with regard to how the market will perform in the future.
 
Still on the Sawtooth Pattern

There are many little sawtooth in that chart, and of less than 10% in magnitude. But if one zooms out, she will see the bigger sawtooths, the less frequent ones that set you back 40 to 60%, like the ones in 2003 and 2008.
Without rebalancing, the S&P 500 looks pretty dismal since the peak of 2000 if one adjusts with the CPI. TIPS are looking better to me after seeing this.
 

Attachments

  • sandpsince2000.jpg
    sandpsince2000.jpg
    45.1 KB · Views: 42
Without rebalancing, the S&P 500 looks pretty dismal since the peak of 2000 if one adjusts with the CPI. TIPS are looking better to me after seeing this.

Yes, thank you. I have been trying to remind folks of what a terrible period we have just been through. They do not call it the "Lost Decade" for nothing.

Now, people who rebalanced did well. I came out having more than I started, but I did not do strict buy-and-hold.

The people still working with fresh money to buy would do well too, as they were in the accumulation phase. But retirees, hello are you there, had to sell to eat. Selling low, and with no money to buy, you are in trouble!
 
Yes, thank you. I have been trying to remind folks of what a terrible period we have just been through. They do not call it the "Lost Decade" for nothing.


Now, people who rebalanced did well. I came out having more than I started, but I did not do strict buy-and-hold.


The people still working with fresh money to buy would do well too, as they were in the accumulation phase. But retirees, hello are you there, had to sell to eat. Selling low, and with no money to buy, you are in trouble!


For those accumulators that U path journey back to even par works out great for them. Now if the past 15 years had been a giant arch shape, not so much. I assume the retirees would have faired better in that type of scenerio than the accumulators? Or at least you would have had 15 years to die before it went bad and then it wouldn't have mattered I guess.


Sent from my iPad using Tapatalk
 
For those accumulators that U path journey back to even par works out great for them. Now if the past 15 years had been a giant arch shape, not so much. I assume the retirees would have faired better in that type of scenerio than the accumulators? Or at least you would have had 15 years to die before it went bad and then it wouldn't have mattered I guess...

Arghh!

800px-See_No_Evil%2C_Hear_No_Evil%2C_Speak_No_Evil.jpg
 
Also, being invested in a much wider range of stocks, including international stocks made a big difference, in addition to holding asset classes other than stocks. Bonds did very well over tht time period.
 
Without rebalancing, the S&P 500 looks pretty dismal since the peak of 2000 if one adjusts with the CPI. TIPS are looking better to me after seeing this.

Thanks you for that chart. I just put those same start/ending dates into my trusty Quicken investment performance calculator and it came up with 4.5% over that time. Not great but I guess the 4% WR is alive and well with a diversified 50/50 portfolio with a value tilt.
 
Thanks you for that chart. I just put those same start/ending dates into my trusty Quicken investment performance calculator and it came up with 4.5% over that time. Not great but I guess the 4% WR is alive and well with a diversified 50/50 portfolio with a value tilt.
You know, I didn't put those dates into my spreadsheet to see what I actually got during that period. I think I'll do that! Maybe that will cheer me up a bit.
 
An annualized return of 4.5% over that terrible period is not bad. But one must also take out inflation for comparison to the S&P chart that sengsational posted.

Cumulative inflation over the last 15 years is 38%. It works out to 2.2% annualized. So, the 4.5% nominal return becomes 2.3% real return. I guess the bond component along with rebalancing are responsible for that.
 
Yep, I just got done with the calculation and 38% is what found too. I actually took the monthly CPI and adjusted the starting balance and all of the cash flows by a factor to turn them all into "today's dollars". I got an internal rate of return of 11.2% over that span. I was in accumulation mode most of that time, so I suspect dollar cost averaging, rebalancing, and being in various asset classes beyond just the S&P 500 is why. So I don't feel so bad telling my daughter to just pick an asset allocation target, keep adding, rebalance occasionally, and ignore the balance fluctuations.
 
But we are not in accumulation mode anymore. It's a different game now.

There's another thread where the fate of a Y2K retiree is discussed. If he drew 4%WR COLA'ed from a 60 stock/40 bond portfolio, his WR would now be up to 6.2% nominal. He's in trouble!
 
But we are not in accumulation mode anymore. It's a different game now.
Absolutely! I'm wondering if the smooth, age-driven asset allocation splits are really wise. It seems like there should be a bigger change when one leaves the accumulation phase.
 
An annualized return of 4.5% over that terrible period is not bad. But one must also take out inflation for comparison to the S&P chart that sengsational posted.

Cumulative inflation over the last 15 years is 38%. It works out to 2.2% annualized. So, the 4.5% nominal return becomes 2.3% real return. I guess the bond component along with rebalancing are responsible for that.
Aye, I guess one should take the nominal official inflation rate out for a true apples to apples comparison but I have to tell you that my personal inflation rate is nothing like the CPI. I don't know if it's a substitution effect or what but my actual dollar expenditures have been remarkably stable over the last dozen years since ER. And the weird thing is, my standard of living feels about the same, eat out just as often, drink the same booze, travel just about as often, get the same toys etc etc. Weird.
 
I do not disagree with you. I do think our cost of living has gone up some, but less than the CPI number. Could it be because we retirees do not buy the stuff that youngsters do? Or perhaps we are following Bernicke's spending pattern without realizing it?

The gummint may be correct in saying that SS recipients do not really need the COLA that is given out. I suggest that we keep this between ourselves, and do not publicize it. No need to give them any ammo.
 
Absolutely! I'm wondering if the smooth, age-driven asset allocation splits are really wise. It seems like there should be a bigger change when one leaves the accumulation phase.

Should there be a change in allocation when one switches from allocation to withdrawal? Absolutely. I imagine many folks do.
 
I do not disagree with you. I do think our cost of living has gone up some, but less than the CPI number. Could it be because we retirees do not buy the stuff that youngsters do? Or perhaps we are following Bernicke's spending pattern without realizing it?

The gummint may be correct in saying that SS recipients do not really need the COLA that is given out. I suggest that we keep this between ourselves, and do not publicize it. No need to give them any ammo.

OK, I'll be quiet....:angel:
 
I happened to look at net worth today, and we are at the same level as where we started the year - after 7.5 months living expenses plus big estimated taxes paid. Now I don't feel like I lost anything!
 
I happened to look at net worth today, and we are at the same level as where we started the year - after 7.5 months living expenses plus big estimated taxes paid. Now I don't feel like I lost anything!

That's wonderful! Congratulations. :) I'm not quite at the same amount, but my present net worth does look better when I compare with the beginning of the year.


I am definitely spending more than I ever have before.
 
Last edited:
That's wonderful! Congratulations. :) I'm not quite at the same amount, but my present net worth does look better when I compare with the beginning of the year.

Well if your present net worth is higher than where you started the year, you are ahead for the year, IMO.
 
Well if your present net worth is higher than where you started the year, you are ahead for the year, IMO.

It's not! That's why I congratulated you. :) It just looks a little less awful when I compare, and consider that it wasn't that wonderful at the first of the year.
 
Last edited:
It's not! That's why I congratulated you. :) It just looks a little less awful when I compare, and consider that it wasn't that wonderful at the first of the year.

OK, I get it. You aren't down as much when you compare it to the start of the year.
 
I happened to look at net worth today, and we are at the same level as where we started the year - after 7.5 months living expenses plus big estimated taxes paid. Now I don't feel like I lost anything!
We keep an Excel graph of where we were financially at each month's end, (house at a fixed rate, and any outstanding CG taxes not included), and have a tendency, (especially after drops), to look back and say "We have the same amount now as we had on such and such a date; we thought we were doing pretty well then, and we've lived/traveled/etc since that time".

Doesn't totally 'cheer us up' after a big drop....but it helps. :)
 
Back
Top Bottom