Clover5
Recycles dryer sheets
- Joined
- May 4, 2013
- Messages
- 78
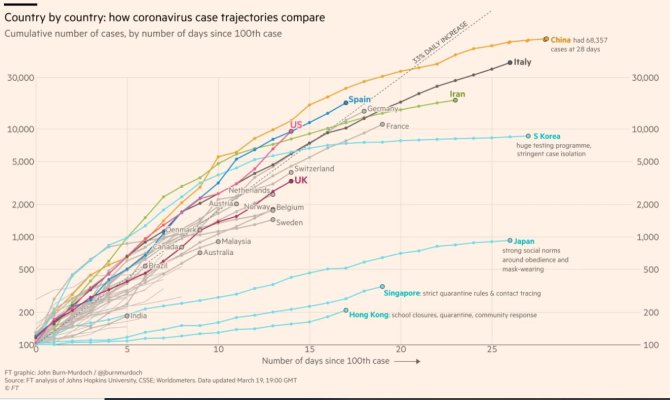
“The number of confirmed cases worldwide has exceeded 200 000. It took over three months to reach the first 100 00 confirmed cases, and only 12 days to reach the next 100 000.”
Am sure lots of this is just the fact testing is becoming more widely available, still pretty startling.
https://www.who.int/docs/default-so...0319-sitrep-59-covid-19.pdf?sfvrsn=c3dcdef9_2
Am sure lots of this is just the fact testing is becoming more widely available, still pretty startling.
https://www.who.int/docs/default-so...0319-sitrep-59-covid-19.pdf?sfvrsn=c3dcdef9_2