- Joined
- Apr 14, 2006
- Messages
- 23,183
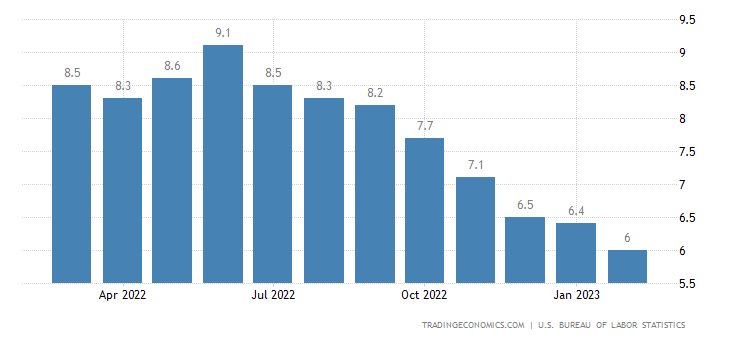
For your viewing pleasure, here is a graph of the year over year inflation rate - monthly for the past twelve months.

Doesn't look too bad when you cut off the y-axis.
Doesn't look too bad when you cut off the y-axis.
For your viewing pleasure, here is a graph of the year over year inflation rate - monthly for the past twelve months.
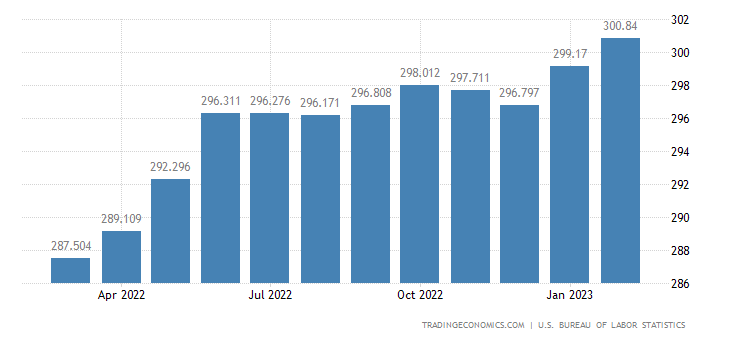
What was the CPI number for August 22, and is there a place to find this online? So far I’ve been saving some of the monthly CPI releases, but I don’t have them all. I don’t know if they are archived somewhere.CPI Release for Feb 2023
CPI = 300.84
Year over year inflation = 6.035%
Inflation since Jun 2022 annualized = 2.29%
Inflation since Aug 2022 annualized = 3.15%
Inflation since Sep 2022 annualized = 2.71%
Inflation since Jan 2023 annualized = 6.7% raw. With seasonal adjustment = 4.8%
May 2023 I-Bond inflation component if no change next month = 2.71%
https://www.bls.gov/news.release/cpi.nr0.htm
Gumby - could you change y-axis to "0-9.5%"?
(oops. I posted before seeing the latest responses.)
What was the CPI number for August 22, and is there a place to find this online? So far I’ve been saving some of the monthly CPI releases, but I don’t have them all. I don’t know if they are archived somewhere.
What was the CPI number for August 22, and is there a place to find this online? So far I’ve been saving some of the monthly CPI releases, but I don’t have them all. I don’t know if they are archived somewhere.
2% inflation rate is under control (if population/productivity is growing by that much.)
6% inflation is NOT under control. Trying to put some temporary "trend" spin on this is just that.. a spin. Data is data.
Excluding volatile food and energy prices, core CPI rose 0.5% in February and 5.5% on a 12-month basis. The monthly reading was slightly ahead of the 0.4% estimate, but the annual level was in line."
Data is data. One's feeling that something is "under control" or not is an opinion, not data. Since 8:37 am this morning, I have presented nothing but data.
Higher ups have only limited times they can purchase or sell company stock, to avoid any impropriety. And sometimes it is taken too far. A church fellow and former higher up in my mega corp, sold stock every year at a certain week in August to pay college tuition. Our mega corp made an announcement on week before his pre scheduled sale, he then in turn went to the legal department to determine whether he should cancel his sale, as not to be in violation. They gave him the green light, saying that he had set a previous pattern of sales 3 years prior. The SEC tagged him, notified mega corp, and they cleared the matter up to not press charges, provided that he resign.
6% inflation is not under control.
All the gimmicks of if you exclude food, energy (and new one lately - housing), then inflation is only this can't hide the reality.
2% inflation rate is under control (if population/productivity is growing by that much.)
6% inflation is NOT under control. Trying to put some temporary "trend" spin on this is just that.. a spin. Data is data.
It’s encouraging to see consistent improvement, and the Fed prior dramatic raises have yet to fully impact the economy as the reactions are usually delayed. Plus the Fed hasn’t even paused yet. No one said the Fed’s job was done.And, for those who think I may be deliberately soft-pedaling inflation, here is my opinion - the Fed's job is not done yet and they should still raise rates by 50bps at the next meeting.
And, for those who think I may be deliberately soft-pedaling inflation, here is my opinion - the Fed's job is not done yet and they should still raise rates by 50bps at the next meeting.
I don’t see any reason to increase more than 25 basis points, and politics has nothing to do with it. Inflationary indicators are softening and much of the economic froth has been cleaned out.
Lost in this latest inflation report is wages, which is of critical important to the Fed. Nominal wages increased 0.2% MoM and 4.6% YoY, and the average hours worked per week declined 0.3% MoM and 0.6% YoY. Real weekly earnings declined 0.4% MoM and 1.9% YoY.
In the Fed inflation model, inflation can only be sustained when there is growth either in wages or credit (or both) Otherwise, consumers must pull back, which contains inflation.
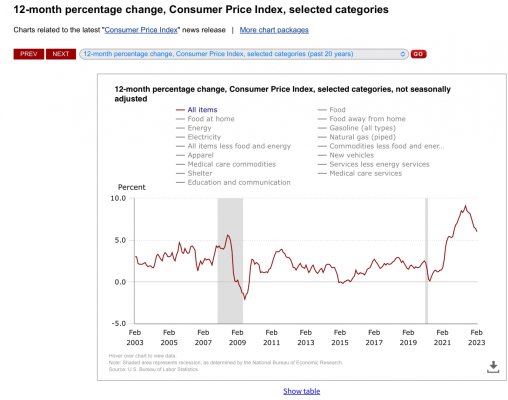
BLS data here and here