2018 YTD investment performance thread

Attachments

  • 2018_Volatility1.png
    2018_Volatility1.png
    12.4 KB · Views: 39
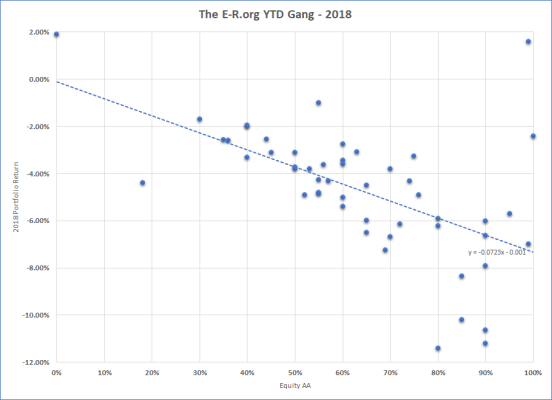
Good luck with trying to get everyone to adhere to a standard. It's a bit frustrating when some use the Beardstown Ladies method (including new investments as part of the return), but like polls here, I take the results as entertainment. I've seen that some of you track your return to a benchmark of the same AA, which is a lot more useful than comparing to a few random people on the internet who are more or less your peers.

I'm not sure what to do with that information anyway. I'm going to stick with my mostly index funds with very low expenses. I'm already motivated to look for the best safe returns on my non-equities. Even with two people having 60/40 AAs, one may be taking on a lot more risk than the other. I suppose if I'm getting consistently lower returns as others with the same AA, I might look at why, but that would require knowing just what they are invested in.

For myself, I admit I don't use the standard method, though when I compared it to moneychimp, I was within a few hundredths, so it's close enough. That method is far from perfect, as you'd get very different results if you withdrew a full year on Jan 1 vs Dec 31.

Also, does the moneychimp method account for the fact that converting to a Roth at a 12% tax rate really isn't a 12% investment loss? It looks like it does, and really shouldn't.

In actuality, the Beardstown Ladies method may be of more interest to me now that I'm retired anyway. How much I spend is as important as how much I make on the investments, so an overall picture of my change from the beginning of the year to the end is good to know. That's of even less use to compare with others because aren't spending down now, or have pensions and SS that have them spending less from actual investments.
 
A Roth conversion would not affect my calculations; taxes are expenses, and I back out expenses with the money chimp style logic.
 
It's time we start a new YTD 2019 returns thread. I want to forget the 5% loss I had in 2018 and start afresh ;)
 
Down about 6.2% in equity portfolio. Approximate security AA is 80/14/6 , one rental (not included in AA) .
About 13% foreign equities out of that 80%.
 
Last edited:
A Roth conversion would not affect my calculations; taxes are expenses, and I back out expenses with the money chimp style logic.
I guess that's close enough. Quick math, lets say you have $100K in a tIRA, on Jan 1 you convert it to a Roth and pay 10% tax. During the year, you make 10%.

100K start of year
90K after conversion, 10K tax expense
99K at end of year after 10% gain

(99K+10K)/100K = 9%

Moneychimp calls it 9.47%, I suppose they figure that 10,000 expense is spread out over the year. They acknowledge it's an estimate without asking for the date and amount of each withdrawal or addition.

For some reason I was thinking it wasn't counted at all. My mistake.

Here is another thought:

gain = 99/(100 - 10) = 1.10 or 10.0%

You start the year basically at 90K after expenses. You end the year at 99K. Maybe I'm missing something?

Generally our expenses are distributed throughout the year but for the overall gain/loss I usually just assume they are taken out at the beginning of the year. Since I've started taking RMD's I move that money to a MM fund so it doesn't earn the 60/40 portfolio return and can easily lag in an up market.
 
When I calculate YTD returns, I factor out any withdrawals and contributions. I add the withdrawals and subtract the contributions. I call this my equivalent return.
 
for me it was -5.98 with 50 stock / 15 int / 35 bonds. but i guess i can look it as half full instead of empty.

My income on this rollover was 51800 for this month reinvestment and 65800 for year.

700+ shares each of two large funds and 650 from my manning int.

that's not bad is it?

i'll be sharing my stuff soon, learned a lot and am in my last year of grinding, but i LOVE what i do !!!!!!!!!!!!!!!!!!!!!!!!!!!!!!!!!!!!!!!!!!!!
 
The postings seem to have tailed off. I have collected 51 data points, including a number of updates/revisions.

I updated my own number based on the Moneychimp discussions here. I finally found the referenced calculator. It changed my estimated return from -3.67% to -3.62%.

Investment Return Calculator: Measure your Portfolio's Performance

Previously, using my simple math I had subtracted my withdrawals from my starting portfolio value (the denominator). I also tried adding my withdrawals back to my final portfolio value (the numerator) and got -3.57%. Moneychimp splits the difference, so seems reasonable.

Anyway plus-or-minus 0.05% is noise and not meaningful.

Enjoy the graph! Quick observations:
  • As expected there are a lot of us between 30/70 and 70/30.
  • Above 75% equities the dispersion of results really increases. There were a couple even more extreme (positive IIRC) but they also actively varied AA during the year so were left out of this graph - DMTs :D
  • Diversification between equities and fixed income works as expected - who'da thunk?
  • As a benchmark, the Vanguard S&P500 ETF (VOO) had a 2018 total return of -4.47%, while "our" trendline crosses 100% equities at -7.33% :(
  • As a benchmark, the Vanguard Total International Stock ETF (VXUS) had a 2018 total return of -14.49% :mad: I suspect that explains why "our" equities under-performed S&P500, I know it is why mine did.
  • As a benchmark, the Vanguard Total Bond Market ETF (BND) had a 2018 total return of -0.08%, while "our" trendline crosses 0% equities at, hmmm, looks like -0.08% to me? It is actually -0.1% per the trendline equation.
 

Attachments

  • ER org 2018 Performance.png
    ER org 2018 Performance.png
    37.7 KB · Views: 44
My YTD numbers include all expenses and what gains or losses from the market. I do not withdraw or add to these investment accounts or rebalance. I take what I need from a savings account ( which is in the moneys I use) so mine is very easy and simple to track. So from the start to a given month or year end is my YTD number/% for that time. I do use the 12 month constant to find that % of gain or lose. That plus or loss in a given time is all that I want to track.
 
redduck's 2018 Portfolio results.

Dividend Portfolio: 0.00% according to Schwab; +0.03% according to moneychimp.
Entire portfolio (including the dividend portion of the portfolio): -2.12%

No outside money is coming into my portfolio (darn!). Any money that goes out (RMD's) is accounted for using moneychimp. For me, the purpose of this exercise is to see how my investments are faring.

Spoiler Alert:
The stuff below is optional reading. Reading it will not make you a better person.

I see my portfolio as being in two parts. One could say "two-parted" but I don't know why anyone would say it that way.

The first part we will call the Dividend Part. It currently consists of 22 dividend stocks. I sort of see the dividend portfolio as part of my bond portion of my portfolio. Hopefully, the dividend stocks are of high enough quality (OK, GE wasn't) that they will boost the income of the bond portion without adding much risk. I have no idea of how well this idea is working.

Anyhow, comparing it to the Wellington fund (-3.32%) I did OK this year with my -2.12%. Even beat VIG (Van. Dividend Appreciation ETF) (-2.40% in 2018). However, this might not be a fair comparison as I don't know if Vanguard uses moneychimp to figure out how they did. Additionally, my portfolio also trounced VLXVX (Van Target Retirement 2065) which came in at -7.95%.
 
Last edited:
Moneychimp and my calculations say we lost 3.29% on a 65/35 portfolio. XIRR says we lost 4.10%, so I have to figure out what I am doing wrong with those entries. Either way, not too bad.
 
Big inflows or outflows at the beginning or end of the year will cause the money chimp style estimate to diverge from the 'gold standard' xIRR.
 
Up 14.7%. Retirement plan is 95% money market and GIC since March of 2017. Biggest nut is private company equity position that returned 29%.
 
Moneychimp and my calculations say we lost 3.29% on a 65/35 portfolio. XIRR says we lost 4.10%, so I have to figure out what I am doing wrong with those entries. Either way, not too bad.


I found a big typo. Now my XIRR says we lost 3.31%. Close enough.
 
Wow, the first time in 19 years cash beats out every other asset class, and the only one actually having a positive return.

If you go after inflation, not a single asset class was positive.
 
I’m only -3% under for 2018 bu that includes incorporating in all the dividends I received. Thank Goodness for dividends!
 
My head is really big after seeing cash was king last year and my CDs smoked the cash return in the table. I’m still down overall, though.
 
Guess I should have been 100% in Ally online savings..... NOT
 
The BLS released CPI numbers. CPI-U less food and energy for 2018 was 2.2%.

So, I guess those who want to add insult to a lousy year can factor that in!
 
My spreadsheet has that column, but I've formatted the text to white on white so I don't see it :)
 
Back
Top Bottom