You are using an out of date browser. It may not display this or other websites correctly.
You should upgrade or use an alternative browser.
You should upgrade or use an alternative browser.
Comparing the 1987 crash to current one
- Thread starter Lsbcal
- Start date
Vincenzo Corleone
Full time employment: Posting here.
- Joined
- Jul 20, 2005
- Messages
- 617
Following.
Closet_Gamer
Thinks s/he gets paid by the post
I am more worried about an unemployment spike. How can business not start laying off tens of thousands of workers if travel and entertainment, sporting, remains shut down?
That for sure will happen...question is duration.
If unemployment benefits kick in -- almost certainly to be supplemented by government action -- then as soon as the virus passes, demand should quickly return and people will get rehired quickly.
If this runs past the point of unemployment and/or the government doesn't step in to support the longer downturn, then I can see this metastasizing into a prolong/much worse financial crisis.
ERD50
Give me a museum and I'll fill it. (Picasso) Give me a forum ...
Thank you, folks.
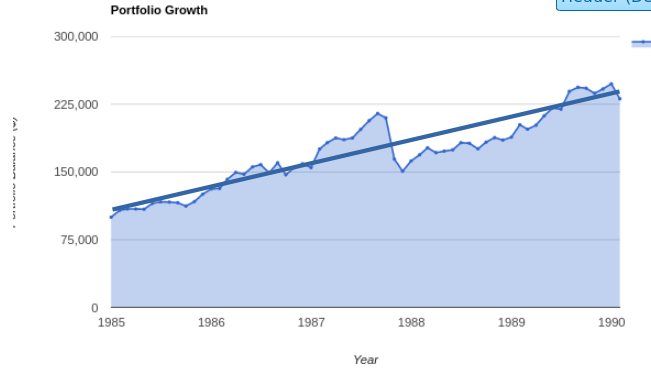
1987 recovery peak-to-peak was about 20 months. Makes me sad.

It might make you feel better to look at the bigger picture. I added a line of growth from 1985. A long term investor, making regular deposits to the portfolio would have done just fine.
I recall the news of 1987, I had been in my career about 12 years, with some money on a 401K (or whatever was available back then). I came into work, we kept making products like we did the day before, I didn't see where some number on TV was going to have that big of an effect. And as I mentioned, 1987 was an up year overall.
I do think this is different. Having people refrain from events, and gatherings, and less activity in general, and some plants shutting down will all have an economic impact. But I also think this will blow over when the effects of the virus are better understood and things hit some sort of status quo, just like the current flu.
edit/add: forgot to add the graph! Up is up, you gotta expect some bumps along the way!
-ERD50
Attachments
Last edited:
OP
OP
Lsbcal
Give me a museum and I'll fill it. (Picasso) Give me a forum ...
I am more worried about an unemployment spike. How can business not start laying off tens of thousands of workers if travel and entertainment, sporting, remains shut down?
That is a concern. On just a technical basis, there is some past evidence that a rise in the unemployment rate (UER) numbers above the 12 month moving average is a very negative signal. Currently the UER is 3.5% but a rise to just 3.6% would trigger this technical signal. I know some will scoff at this but I would take a rise to 3.7% seriously. That report comes out the first Friday of the month, next is April 3rd.
I looked it up and this UER signal was fine in 1987 all the way out to October 1989. Of course, this is quite a different economy with very low absolute UER compared to 1987.
Fermion
Give me a museum and I'll fill it. (Picasso) Give me a forum ...
So currently there are 5.8 million unemployed I think, according to the latest figures.
There are 15.1 million restaurant employees in the USA. I would not be shocked to see 25% of them laid off. It is a tight margin business and you can't close a restaurant for 6 weeks or have it run at 20% capacity for long with full employees.
This is just restaurants. Airlines, sporting events, even auto dealerships eventually.
My prediction if this thing doesn't somehow blow over very quickly in the next month or two is the ranks of unemployed will probably double to 12 million or so.
So something around 7.5% unemployment rate''
(offset somewhat by increased hiring by toilet paper manufacturers)
Nice .. adding tons when we get to that -35%
I remember the October 1987 crash well. DW had come down with pneumonia and we had a 3 year old boy. It was nerve wracking.
I created this chart to show me how the current crash compares to then. The current crash was on us much more rapidly probably because the cause is very different.
This chart starts from the peak of the SP500 in August 1987. The red line is the current market as of 3/12/2020 and the time line just shows the 1987 period. The chart extends out to about 1 year from the peak.
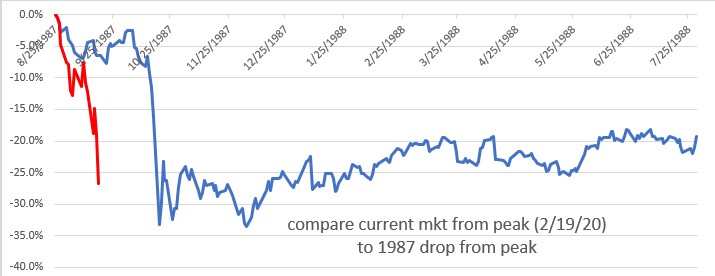
I might update this over time and display if there is interest.
I am more worried about an unemployment spike. How can business not start laying off tens of thousands of workers if travel and entertainment, sporting, remains shut down?
I've seen at least 10 comments on twitter yesterday that they already got laid off.
Norwegian airlines just laid off 50% of employees after Trump announced the travel ban.
Fermion
Give me a museum and I'll fill it. (Picasso) Give me a forum ...
I've seen at least 10 comments on twitter yesterday that they already got laid off.
Norwegian airlines just laid off 50% of employees after Trump announced the travel ban.
So can we put any kind of guesstimate to the level unemployment might reach in April?
Is the idea that it could jump from 3.7% to 5% or 6% unreasonable or maybe even low?
Long term it should all work out. People are not going to stop flying over the next decade, or stop eating out or going to Disney. It might be that the market just absorbs this as a short term phenomenon.
A great policy would be zero interest loans with no payment due until 2021 for any restaurant or travel related business that does not lay off employees during this time. I mean the money is going to go out to them anyway via unemployment and this would be a great morale booster for the industry.
OP
OP
Lsbcal
Give me a museum and I'll fill it. (Picasso) Give me a forum ...
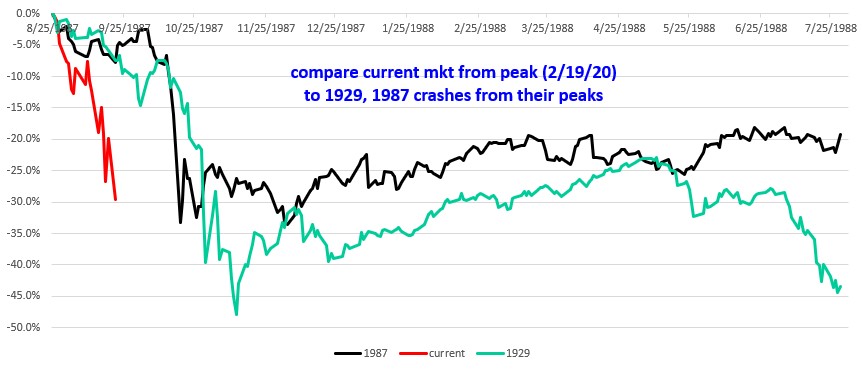
I updated this for today's miserable decline. I added data from the 1929 crash. For the 1929 crash things got much worse until 1932 and this only shows the data to about September 1930.
OP
OP
Lsbcal
Give me a museum and I'll fill it. (Picasso) Give me a forum ...
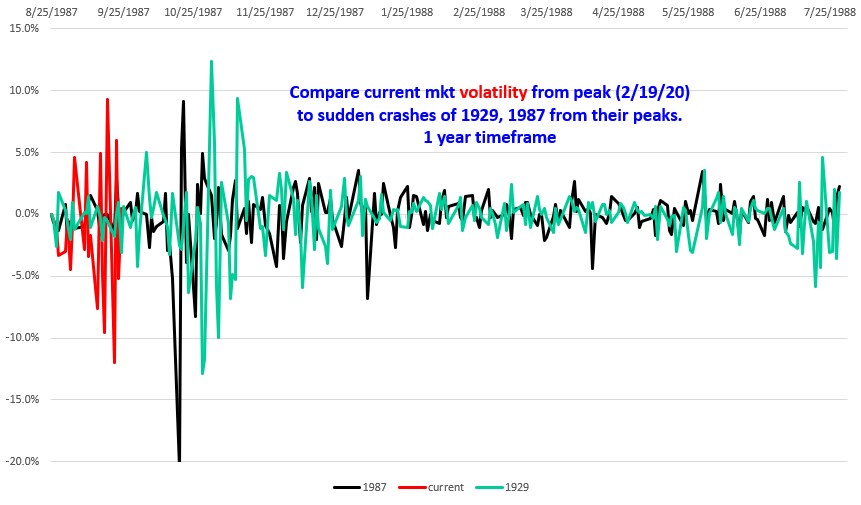
Here is a similar chart showing the daily moves of the 3 crashes:
- Joined
- Oct 13, 2010
- Messages
- 10,766
Interesting. Could you post your start date for each, or did I miss that?
OP
OP
Lsbcal
Give me a museum and I'll fill it. (Picasso) Give me a forum ...
Interesting. Could you post your start date for each, or did I miss that?
The charts align the curves with the peaks which occurred in:
2/19/2020
8/25/1987
9/03/1929
Midpack
Give me a museum and I'll fill it. (Picasso) Give me a forum ...
+2Yes, I always love your charts Lsbcal.
- Joined
- Oct 13, 2010
- Messages
- 10,766
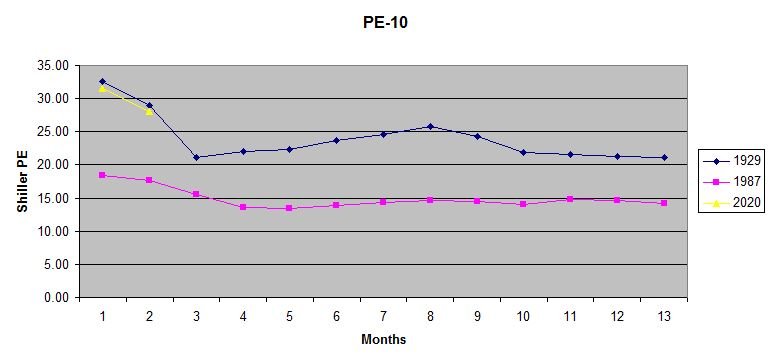
Shiller PE / CAPE Ratio
Using the data from here: https://www.multpl.com/shiller-pe/table/by-month I pulled together 1929, 1987 and now.
The data is by month, so I used the month immediately before the peaks. I made a graph after adjusting the ratio for the exact day of the peak, but it didn't make the chart look much different, so I'm just posting data found in the link, above, for 9/1/1929, 7/31/1987, and 1/31/2020.
Obviously this looks more like 1929 when viewed in this light.
Attachments
- Joined
- Oct 13, 2010
- Messages
- 10,766
OP
OP
Lsbcal
Give me a museum and I'll fill it. (Picasso) Give me a forum ...
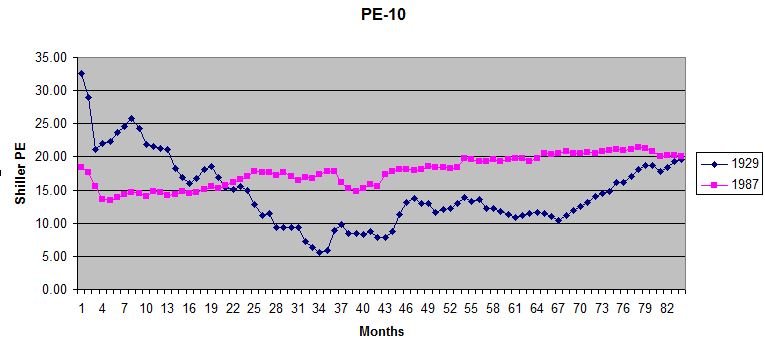
We know that PE10 is not predictive of the short term.
My intention in this thread was to compare relatively short term price behavior. Scoping out will clearly give a broader picture. I have a price chart like that but we are experiencing this real time so I wanted to capture that here in the short term (1 year out).
My intention in this thread was to compare relatively short term price behavior. Scoping out will clearly give a broader picture. I have a price chart like that but we are experiencing this real time so I wanted to capture that here in the short term (1 year out).
OP
OP
Lsbcal
Give me a museum and I'll fill it. (Picasso) Give me a forum ...
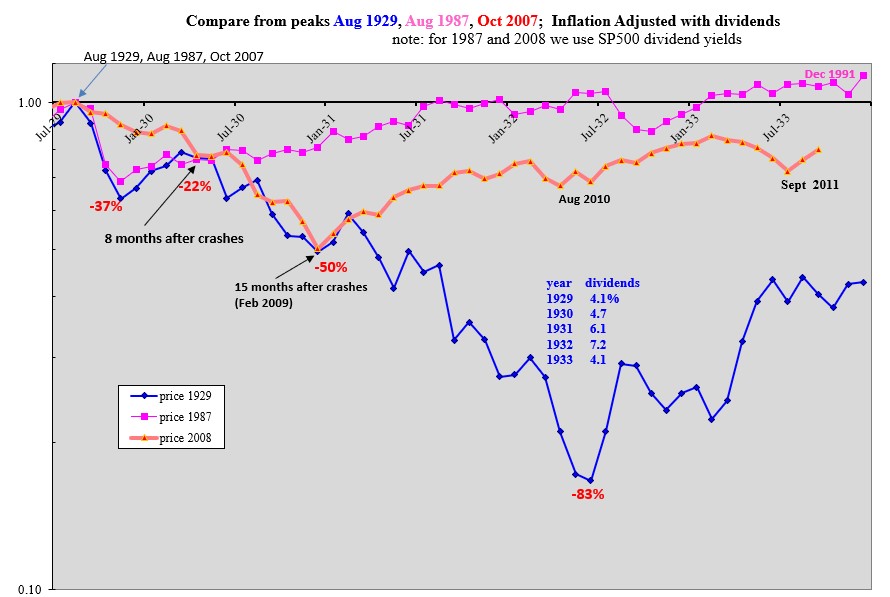
I added the 2007-2008 decline (gold line) which started from the peak on Oct 9, 2007. So since this is just a 1 year chart it just goes to Oct 2008 and doesn't show the full horror of that decline which bottomed in Feb 2009. TARP was enacted in early October 2008 yet the market did not bottom for 4 months after that.
The current 2020 (red line) goes through March 20.
As I mentioned above, I wanted to show what things looked like just 1 year after the peak. Kind of interesting because we know that things got much worse even after 1 year for the 1929, 2007 periods. The 1987 period did not have rising unemployment and no recession either. So I think the 1987 crash is not quite like our current crash regarding fundamentals.
Last edited:
OP
OP
Lsbcal
Give me a museum and I'll fill it. (Picasso) Give me a forum ...
Backing up to show some more years. Here is a longer term view. Note semilog plot here. In 1932 things got so bad stocks were off -83% (red numbers).
Which color line are we on now?
Which color line are we on now?
gcgang
Thinks s/he gets paid by the post
- Joined
- Sep 16, 2012
- Messages
- 1,571
Feels more like 1929.
Are we overdue for another Great Depression?
Are we overdue for another Great Depression?
audreyh1
Give me a museum and I'll fill it. (Picasso) Give me a forum ...
We know that PE10 is not predictive of the short term.
Also the last 5 months PE10 is missing current earnings data, so it’s projected based on Sept 2019 earnings. It’s not really a real-time reading. Now in a few months we can look back and get complete recent month data.
audreyh1
Give me a museum and I'll fill it. (Picasso) Give me a forum ...
PE10 has definitely dropped dramatically, we just don’t know the precise number yet. And when earnings start to drop it will act to push it up too.
Closet_Gamer
Thinks s/he gets paid by the post
Backing up to show some more years. Here is a longer term view. Note semilog plot here. In 1932 things got so bad stocks were off -83% (red numbers).
Which color line are we on now?
The Great Depression chart is striking. I never knew it went down 83%

REWahoo
Give me a museum and I'll fill it. (Picasso) Give
The Great Depression chart is striking. I never knew it went down 83%
Even more impressive is the fact that FIRECalc says at my current withdrawal rate my portfolio survival rate would have been 100% - even with that 83% decline.
Similar threads
- Replies
- 406
- Views
- 56K
- Replies
- 35
- Views
- 5K
- Replies
- 68
- Views
- 10K