Awfully convenient to only use data since 1988. Try starting in 1974 and you get a different result.
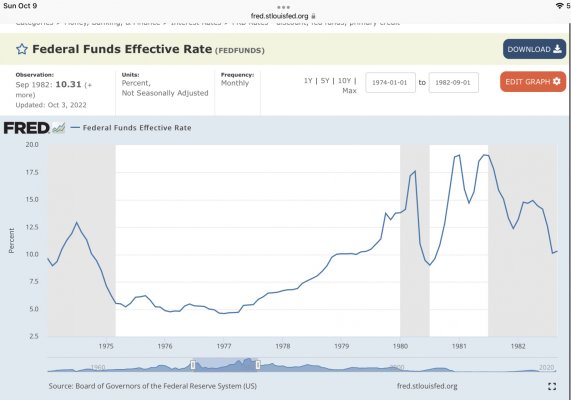
Here’s a chart of the effective federal funds rate from 01/74 thru 09/82. https://fred.stlouisfed.org/series/FEDFUNDS
This chart does not show how high rates got, it shows how fast they were raised. It took 6 years to go from 5% to 17%, 1974 to 1980. They then fell to 10% for a few months, and increased once again from (approximately) 9% to 18% in less than a year.
Without getting into the data it looks like the current rate hike matches the one in late ‘80 in speed for the first 6 months. There’s little likelihood it will get close to the levels of the early 80’s, as the recession it created was brutal. In addition, inflation was chronic then, and there’s no evidence it is similar now.