NW-Bound
Give me a museum and I'll fill it. (Picasso) Give me a forum ...
- Joined
- Jul 3, 2008
- Messages
- 35,712
^^^ As I said, people chart different courses. ")
It’s true that after the 1980s the curve came out of inversion before the recessions began. But if you look at those two early 80s recessions, the curve was more strongly inverted to start, and also stayed inverted until near the end of the recessions. Back then the Fed was fighting inflation. Is inflation back? Is the Fed fighting it?
Showing off again, huh?
I took 6 calculus courses in engineering college and I can't even speel calculus any more!
Yield curve is reputed to be a 'leading indicator' of recession.
https://www.investopedia.com/terms/i/invertedyieldcurve.asp
Everyone's course is different.
Some try to swerve around a pot hole, some drive over it.
Yes, to each, their own, always. For myself, every single time before that I thought the future was clear and tried to swerve, I’ve ended up in the ditch. Now I hit the potholes straight on and keep going.
Another thing I noticed. If all the corrections depicted in the chart are different, what kind of insight are we looking for when we keep trying to find a previous correction that looks like the current one? Why would it look like any of them? And if it does why would that tell us anything?
Mostly rhetorical questions I suppose.
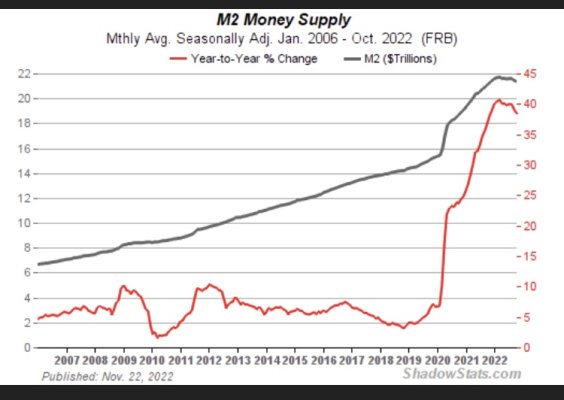
^^^^ Namely that 40% of all dollars in existence have been conjured from thin air since 2020. Cash injections to suffering people and businesses (Main Street) rather than the usual banksters (Wall Street) was worthy. Nonetheless, excess dollars chasing the same or fewer goods and services = inflation.
But if we have a recession in the midst of inflation, that = stagflation.
Eh, I can still do integration by parts, and solve some simple ODEs. Still remember many trig identities too.
And that's why they still want me to go back to work.
However, I make more money at home selling options than they can afford to pay me. So, no thanks.
. For example, if an investor saw the similarity of the dot-com bubble to the tulip bubble, that would save his skin.
Well, M2 peaked in 1Q22 and has been declining since then, so if M2 drove inflation it should be negative right now, which it clearly is not.
Demand remains strong, and is driven by wage growth, which remains robust. Excess dollars are driving inflation, but they are coming from salaries, not Central Bank actions.
My (limited) understanding is that the money pumped in over the past 2 years is still in the system and is affecting inflation. True, they've (finally) quit stimulating, but there must be a lot of dollars still floating around. They ARE drying up somewhat as folks are now back to using credit instead of left over stimulus money. Hawaii still has (literally) tons of stimulus money lying around from Covid - yet to be spent. Our (state) gummint sent us all $600 recently because they had so much.
Demand may also be driven by shortages though I'm no expert. Shortages drive inflation as well (I think.) YMMV
Yes, but can you still apply L'Hospital's rule? Heh, heh, I still recall learning how to pronounce it, but haven't otherwise thought about it in 55 years - so YMMV.
Yes, the money injected in the past 2 years did stimulate demand, and fed the fires of inflation. That was fiscal spending, not M2 or other monetary stimulus, as argued in an earlier post.
The additional fiscal spending has ebbed and is returning to earlier pre-pandemic levels, and supply for manufactured goods has improved, yet inflation persists. Consumer spending is remaining high.It appears that a combination of continued employment gains and continued high wage increases are the drivers, the primary being wage increases.
This is not good news, because when wages and prices feed into each other inflation is very difficult to control.
Eh, it is called l'Hôpital's rule because it's named after a French mathematician.
Yes. This rule is one of the obvious ones.
if an investor saw the similarity of the dot-com bubble to the tulip bubble, that would save his skin.
... the experience of the 1980s may become instructive. And once you dig into the history, the decade holds three tough lessons for today’s policymakers. First, inflation can take a long time to come down. Second, defeating inflation requires the participation not just of central bankers, but other policymakers too. And third, it will come with huge trade-offs. The question is whether today’s policymakers can navigate these challenges.
Markola said:You really think wages and prices are behind this inflation? I do not. Look at this: