C
Cut-Throat
Guest
LOL! said:Did you eat your dividends or re-invest them?
All re-invested!
LOL! said:Did you eat your dividends or re-invest them?
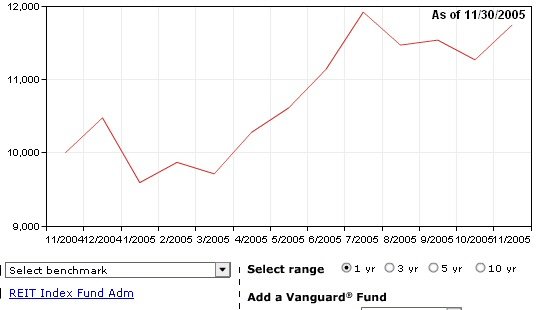
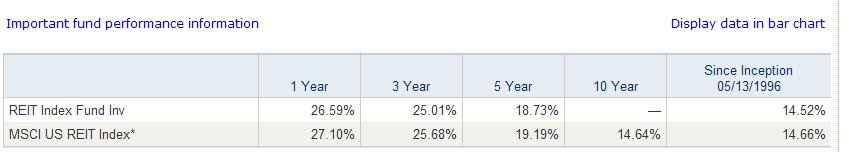
TromboneAl said:Where are you getting the 26.5% figure?
 -This is when I customized an investment performance report for just the REIT index fund.
Cut-Throat said:I lose more faith in Quicken every day!
). As I said in another thread, "...my attitude towards their [Intuit's] entire product line is that you should open the lid on the toilet and throw them intuit."LOL! said:Let's show how YTD calculations are troublesome.
Suppose I have on 12/31/2004 $30,000 I invest an additional $5000 on Jan 4, 2005 and now I have $40,000. Since the $5K was there almost the whole year, it's like a $35K at the start, $40K at the end, so for all practial purposes the YTD is 14.3%
But suppose I invest the $5K on 12/22/2005. In essence, the $5K wasn't in the account long enough to make a difference. It's like I have $30K invested the whole year that increased in value by $5K to $35K, then I added $5K. So my return is very close to 16.7% (35K/30K).
In essence, one needs to carefully consider the amount of time each bit of money was invested. And that's what MSMoney, PFROI, and Quicken are supposed to be good at.
REWahoo! said:I gave up on Quicken years ago (DW says I have "incredible" patience
LOL! said:Let's show how YTD calculations are troublesome.
Suppose I have on 12/31/2004 $30,000 I invest an additional $5000 on Jan 4, 2005 and now I have $40,000. Since the $5K was there almost the whole year, it's like a $35K at the start, $40K at the end, so for all practial purposes the YTD is 14.3%
But suppose I invest the $5K on 12/22/2005. In essence, the $5K wasn't in the account long enough to make a difference. It's like I have $30K invested the whole year that increased in value by $5K to $35K, then I added $5K. So my return is very close to 16.7% (35K/30K).
In essence, one needs to carefully consider the amount of time each bit of money was invested. And that's what MSMoney, PFROI, and Quicken are supposed to be good at.
Like TH, I don't download transactions because it just freakin' doesn't work right!NYCGuy said:I never download transactions from financial institutions because to do so defeats the purpose of running a home accounting system: reconciliation of my view of what happened to their view of what happened.
NYCGuy said:I never download transactions from financial institutions because to do so defeats the purpose of running a home accounting system: reconciliation of my view of what happened to their view of what happened.
NYCGuy said:reconciliation of my view of what happened to their view of what happened.
Lancelot said:Quicken YTD = 8.69% (seems that Quicken excludes cash)
Quicken December 24, 05 - Portfolio spread sheet balance Dec 31, 04 = 6.6% (includes living expense withdrawls, cash, everything...)
I've started keeping a spread sheet listing Dec 31 portfolio balances (including cash), total living expenses and withdrawl percantage.
I can understand the importance of YTD figures, but total portfolio percentage increase/decreases are the most meaningful to me.
Lance