jollystomper
Give me a museum and I'll fill it. (Picasso) Give me a forum ...
- Joined
- Apr 16, 2012
- Messages
- 6,225
I originally posted this in the Blow That Dough! 2020 thread. A few people were interested in hearing more information, so here goes the nerdiness... you have been warned. ")
One of my projects of interest is tracking temperature/humidity inside and outside of our home. My requirements were to monitor at least 6 different areas and feed the data into my home computing center to apply my desired analytics, integrate with other data, or whatever else came to mind.
I wanted to start simple – it is easy to start simple and choose to make it complex, than the other way around. I also wanted to start relatively cheap.
I debated the "build your own" option using Raspberry Pis, sensors, and connecting components, or a more "out of the box" solution. But in true "Blow That Dough" mindset, I realized, "why not both?" My starting point ls likely not the “optimal” or “best” option, it is just the one I chose as a quick, simple way to start leaning and implementing this stuff.
The simple "out of the box" solution I uses the Ambient Weather WS-3000 monitor with 8 sensors (description at https://ambientweather.com/amws3000x8.html). The sensors run on batteries, which gives more flexibility for where to place them. The WS-3000 can record the collected data on a SD card. So my initial thought was to add an SD card, and either (a) occasionally take it out to copy the data, or (b) use the Ambient software for this monitor to sign on and copy/paste the data as needed.
One challenge is that it keeps separate data files for each sensor. Unfortunately, the device does not give visibility to the SD card as a drive when connected via USB.
However, knowing that I am not the sharpest nor earliest tool in the shed, I searched to find if others has done anything to improve automating the data collection. Sure enough, on GitHub there are a couple of packages one can try. One is node.js based, one is python, I used the node.js package (https://github.com/EpicVoyage/ambientweather-ws3000) as it seem easier to get it up and running.
The package requires Linux to run on. Looking at the source code it finds the ws3000 based on messages emitted in the Linux dmesg command when the ws3000 is connected to the USB port. It then sends the appropriate commands (not documented but from network tracing they figured out the command format) to retrieve temperature and humidity data.
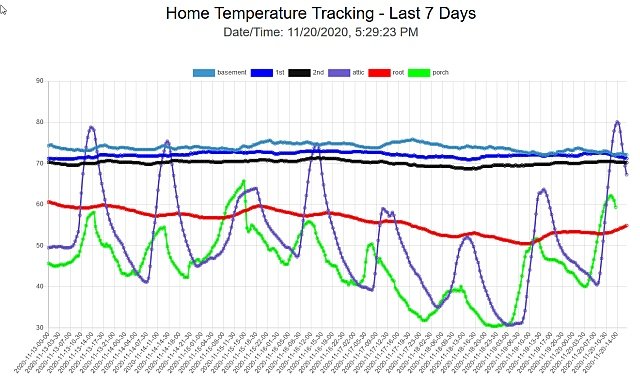
Having worked with node.js at MegaCorp (though not having touched it since retiring I did need a little refresher, thank you internet), I was able to quickly set up a process where, every 30 minutes, Linux runs a node.js JavaScript program to retrieve the current data for all of the sensors, do any calculations I need (e.g. the sensor temperature data is in Celsius so I calculate the Fahrenheit equivalent) and write it to a csv file. Another node program reads the csv file and extracts data for use by a JavaScript program that uses the graph.js Javascript package to generate a quick-and-dirty line chart. Another node process runs as a web server that I can use to display the line chart (and any other charts I might choose to create).
I am starting to analyze the data, and already see some interesting correlations for starters that many lead to me "tweaking" some aspects of home thermostat/dehumidifier/attic fan just to see if things change.
I have decided I want to do more customized queries (e.g, retrieve data for particular sensors within a given time range), so, in addition to saving the data as a .csv file, I also store it in a sqlite database (yeah, I could just use sqlite and the .csv file, but for now, storage is cheap).
Also, this gives me incentive to educate myself on writing an Android app, so that I can get the data on my phone.
This has will give me time to play with the "build your own" option as a self-education project, and feel not feeling "rushed" to get something working. I’ll likely look at some hardware architecture around a Raspberry Pi, wife controllers, and sensors, but I have to do more (and leisurely research) on this. It will be interesting to see how the costs compare..., but no worries, Blow that Dough!
Anyway, as I said, not the best or most efficient way (a picture would be a lot clearer than my ramblings). But for me, sometimes the journey by itself can be a learning experience, so I do not mind hacking around and making the journey longer (and hey, I’m FIRE, so no need to rush it!)
One of my projects of interest is tracking temperature/humidity inside and outside of our home. My requirements were to monitor at least 6 different areas and feed the data into my home computing center to apply my desired analytics, integrate with other data, or whatever else came to mind.
I wanted to start simple – it is easy to start simple and choose to make it complex, than the other way around. I also wanted to start relatively cheap.
I debated the "build your own" option using Raspberry Pis, sensors, and connecting components, or a more "out of the box" solution. But in true "Blow That Dough" mindset, I realized, "why not both?" My starting point ls likely not the “optimal” or “best” option, it is just the one I chose as a quick, simple way to start leaning and implementing this stuff.
The simple "out of the box" solution I uses the Ambient Weather WS-3000 monitor with 8 sensors (description at https://ambientweather.com/amws3000x8.html). The sensors run on batteries, which gives more flexibility for where to place them. The WS-3000 can record the collected data on a SD card. So my initial thought was to add an SD card, and either (a) occasionally take it out to copy the data, or (b) use the Ambient software for this monitor to sign on and copy/paste the data as needed.
One challenge is that it keeps separate data files for each sensor. Unfortunately, the device does not give visibility to the SD card as a drive when connected via USB.
However, knowing that I am not the sharpest nor earliest tool in the shed
, I searched to find if others has done anything to improve automating the data collection. Sure enough, on GitHub there are a couple of packages one can try. One is node.js based, one is python, I used the node.js package (https://github.com/EpicVoyage/ambientweather-ws3000) as it seem easier to get it up and running.The package requires Linux to run on. Looking at the source code it finds the ws3000 based on messages emitted in the Linux dmesg command when the ws3000 is connected to the USB port. It then sends the appropriate commands (not documented but from network tracing they figured out the command format) to retrieve temperature and humidity data.
Having worked with node.js at MegaCorp (though not having touched it since retiring I did need a little refresher, thank you internet
), I was able to quickly set up a process where, every 30 minutes, Linux runs a node.js JavaScript program to retrieve the current data for all of the sensors, do any calculations I need (e.g. the sensor temperature data is in Celsius so I calculate the Fahrenheit equivalent) and write it to a csv file. Another node program reads the csv file and extracts data for use by a JavaScript program that uses the graph.js Javascript package to generate a quick-and-dirty line chart. Another node process runs as a web server that I can use to display the line chart (and any other charts I might choose to create).I am starting to analyze the data, and already see some interesting correlations for starters that many lead to me "tweaking" some aspects of home thermostat/dehumidifier/attic fan just to see if things change.
I have decided I want to do more customized queries (e.g, retrieve data for particular sensors within a given time range), so, in addition to saving the data as a .csv file, I also store it in a sqlite database (yeah, I could just use sqlite and the .csv file, but for now, storage is cheap).
Also, this gives me incentive to educate myself on writing an Android app, so that I can get the data on my phone.
This has will give me time to play with the "build your own" option as a self-education project, and feel not feeling "rushed" to get something working. I’ll likely look at some hardware architecture around a Raspberry Pi, wife controllers, and sensors, but I have to do more (and leisurely research) on this. It will be interesting to see how the costs compare..., but no worries, Blow that Dough!
Anyway, as I said, not the best or most efficient way (a picture would be a lot clearer than my ramblings). But for me, sometimes the journey by itself can be a learning experience, so I do not mind hacking around and making the journey longer (and hey, I’m FIRE, so no need to rush it!
)