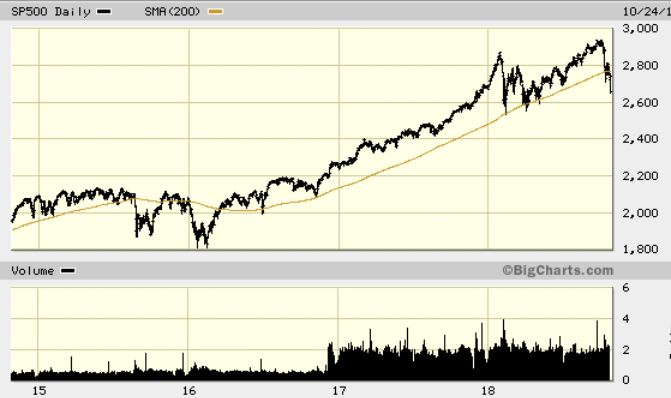
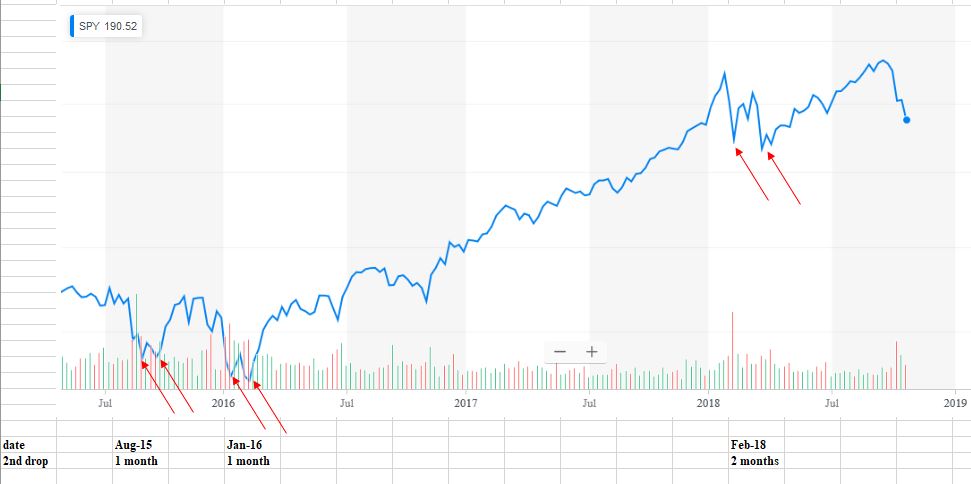
Nibbling along the edges?

I retired from the stock market pretty much in 2009.I decided to depend on my own earning power through my very small business.It turned out fine.I just retired at 65 last year from my business and have been about 65 pct CDs with the rest in Ibonds,a couple high quality GO muni’s and a few high quality Corp bonds.Throw in a few vanguard bond funds and a dash of Wellesley which is my only stock holding.Right now that portfolio is yielding about 47,000 per year and I sleep like a baby.No real regrets about missing the bull because that is hindsight.It could have been much different.

I feel sorry for your wife. That waking up, crying every two hours would drive me crazy!
 
Sleep like a colicky baby? :nonono:
 
Total market index (looking at VTI) made it to -10% today but believe S+P is at -9% from market high.
 
Bought 53k Spy on the close today, hoping for a "pop" this week before we turn lower. The selloff/rally yesterday and sell off today happened on 1/2 the volume you would expect for a market bottom.
 
Bought 53k Spy on the close today, hoping for a "pop" this week before we turn lower. The selloff/rally yesterday and sell off today happened on 1/2 the volume you would expect for a market bottom.

How do you arrive at this sort of idea?

I'm tempted to buy some SPY for a rise over the next couple of months. Maybe another 5% of portfolio. The market data I look at shows no signs like previous major declines into recessions. US leading index is in "normal" territory, we don't have an inverted yield curve, etc. On the other hand, politically things seem somewhat unstable, possible worse trade war scare, etc. There is always an "on the other hand".

I have no way of timing a market panic and no way to estimate the bottom. My feeling is Mr Market is a scaredy cat at the moment. Could turn any time.
 
The market is turning so gloomy.

Freeport McMoran, a copper producer that I own shares of, reported earnings and revenues that slightly beat expectations. For the rest of the year, maintained earlier forecast.

Result? Share price is down -7.84% today. You can't win!
 
In volatile markets in a downward trend (we have broken the 200 and 300 day moving averages)many times are accompanied by violent upswings (like yesterday). MACD ( momentum indicator) suggests we are due for some relief soon.

Bottoming is a separate issue and I have no idea when (I will know it when I see it) may be a ST bottom or hopefully a LT bottom. It will involve a retest of some low and I would not be comfortable with less than 300-400 million shares traded.

This is just my feeling and I was proven wrong in early October and have had to trade my way out of it. YMMV.

Well that is an honest answer. Thanks. :)

FWIW, here is a chart with the 200 day moving average (source is BigCharts):

Capture.jpg
 
The market is turning so gloomy.

Freeport McMoran, a copper producer that I own shares of, reported earnings and revenues that slightly beat expectations. For the rest of the year, maintained earlier forecast.

Result? Share price is down -7.84% today. You can't win!

Unless you bought TSLA!

FYI- I have never owned Tesla although I do own shares in a Chinese competitor.
 
I'm not a chartist but have sometimes heard and seen evidence of a "double bottom" formation. So here are some recent ones that I see and the times between the first low, and upward move, and then a "retest" of the low.

Maybe a wait is in order if one wants to trade into this:

Capture.jpg


Or one could interpret this chart as the first bottom in Aug-15 and the 2nd bottom in Jan-16. In which case we could have some months to go to hit that 2nd bottom. Or is this bottom a retest of the Jan-18 decline? Fun and games.

"I see Dead People!"

Maybe, you want to repost this in a recent thread specifically for chartist?
There are many "reversal patterns" So, I personally don't go around looking for "double bottoms". The 2015-2016 pattern that preceded what some call the "Trump Rally" was in my mind a "Reverse Head & Shoulders". I remember being "extremely short" the night of the election expecting a different outcome. The futures were down 800 points and I stood to make alot of money, We all know how that turned out. Point is "I did not see that train coming from a chart!

Back to my earlier post. I was expecting a pop today and boy did we get it! I sold my position a few minutes ago when we crossed the 300 day MA ( my goal). It appears to "have legs" and we may even reach the 200 day MA before the next leg down.
 
I'm not a chartist either, just thought it was an interesting visual. Did not mean to get the thread off topic.
 
I'm not a chartist either, just thought it was an interesting visual. Did not mean to get the thread off topic.
No problem, I like charts as well! During the 'trading day" I normally have 10-20 on my platform that I am scrolling through, if I think maybe,perhaps I might do something. But, I was a futures trader 30 years ago and old habits die hard!
 
Another reversal today. Market opened strong. I decided to buy back some call options, and booked a few hundred bucks, although the expiry is not till 11/16. Then, wrote a couple of contracts for another few hundred bucks.

Went out do some work, and got back inside for lunch to see the Dow is down 500 points. It recovered to be only 245 down, but is still terrible. With the market doing head fakes like this, nobody will want to buy, or if he does, will not hold and will sell for short-term trades. Makes it hard for the market to get back to anywhere near its recent high.
 
I guess we don't know where the bottom is. But I'm sure one of us will pull the lucky ticket. :)

Still waiting for someone to give my the formula for calling the bottom.
 
Couldn't help myself, went in and bought $120K SPY today!

Stop buying so the market can stop going down. :angel:

I bought some SPY today @ 3:55pm. I will likely sell it near the open tomorrow regardless of whether it is up, down, or unchanged. I simply bought it because I thought we were seeing some strength into the close.
 
Another large semiconductor equipment company, KLA-Tencor, reported earnings after market close today. Both top and bottom lines exceeded estimates. I don't know how their projections for the next quarter look, but share price jumped 6% after-hour.

Will see if that peters away tomorrow, like with Lam Research earlier. This market is so gloomy.
 
Stop buying so the market can stop going down. :angel:

I bought some SPY today @ 3:55pm. I will likely sell it near the open tomorrow regardless of whether it is up, down, or unchanged. I simply bought it because I thought we were seeing some strength into the close.

+1 They are going to try to test the 300 day moving average (2710) so you might want to hold on for that!
 
+1 They are going to try to test the 300 day moving average (2710) so you might want to hold on for that!

Playing along here. Put a stop limit order in a little under 264 (2640 on $SPX). Will see if we continue up this morning or I get stopped out.

i am at w**k today so I can't watch it minute by minute, thus the stop. [It is the time of the term where students come to office hours, i.e. mid-term grades received last week.]
 
The after-hour jump in KLA-Tencor yesterday after earnings report seems to hold so far. Another smaller semi firm where my son works also reports good earnings and revenues. Share price jumps 16%. A capacitor maker reported earning surprises of 43%, continuing the trend in the last 4 quarters. Stock jumps 8%.

I own the stocks mentioned above. Yet, all these stocks are far below their recent peaks. Investors are afraid of the repeat of 2000, when the electronic industry suddenly hit a brick wall when all the dot-coms imploded, taking away all the demands for servers, routers, etc...

Will see what happens next, but today the market shows some positive responses to good earning reports.
 
Last edited:
Playing along here. Put a stop limit order in a little under 264 (2640 on $SPX). Will see if we continue up this morning or I get stopped out.

i am at w**k today so I can't watch it minute by minute, thus the stop. [It is the time of the term where students come to office hours, i.e. mid-term grades received last week.]

Update: Got stopped out (about break even) as the afternoon margin calls arrived.

I am considering next steps, market is acting a bit better today as the carnage seems to be on the large capt tech (e.g. AAPL) vs the Russell 2000, e.g. IWM. I feel a bit foolish on this one because I was going to buy the IWM yesterday instead of SPY, and talked myself out of it.

ETA: Interesting that I am positive at the moment even with my largest holding (Apple) negative on the day.
 
Last edited:
The after-hour jump in KLA-Tencor yesterday after earnings report seems to hold so far. Another smaller semi firm where my son works also reports good earnings and revenues. Share price jumps 16%. A capacitor maker reported earning surprises of 43%, continuing the trend in the last 4 quarters. Stock jumps 8%.

I own the stocks mentioned above. Yet, all these stocks are far below their recent peaks. Investors are afraid of the repeat of 2000, when the electronic industry suddenly hit a brick wall when all the dot-coms imploded, taking away all the demands for servers, routers, etc...

Will see what happens next, but today the market shows some positive responses to good earning reports.

I see that the small and midcap growth ETF's have been having a higher bounce up then large cap growth (see small/mid/large = vbk/vot/vug). I have large positions in vot and vug.

This market does not at all resemble the year 2000 market IMO.
 
This market does not at all resemble the year 2000 market IMO.

No, it does not.

In fact the market is so skittish the semiconductor segment has been liquidated while its earnings are still good. And P/E ratios of many semi companies are now lower than that of the current S&P, let alone their P/E back in 2000.

The reason the market is so scaredy-cat is why I still hang on to these stocks, despite the beatings they have been taking.
 
Last edited:
PS. Back in 2000, nearly all tech stocks, not just chip companies, had P/E as high as 100. That's the current P/E of Amazon.

Maybe only a few companies have the growth to sport a stratospheric P/E like that, but when there were hundreds of such companies, it was too good to be true.

And Amazon is down to 75% of its peak. P/E is still at 120 though.
 
Last edited:
Back
Top Bottom