Only a little under 30 points before the S&P500 hits the 200 day MA

I fouled up.

I told my wife 2 weeks ago I was going to move the majority of our equities into our MM account until the market jitters calmed down. Well, my son and daughter took some leave and flew home. Our family went on a week long backpacking trip into the Eagle Cap wilderness in NE Oregon. This is a heck of a thing to be greeted with on my return. Value of portfolio dropped by $150K. I believe I will ride it out now.
 
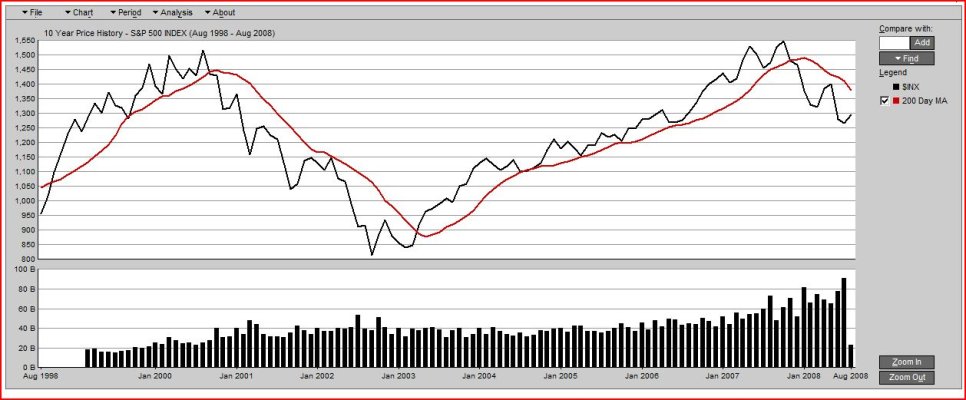
If you think about it, breaking a 200 day MA does not necessarily mean we're in the midst of a strong trending downturn. Suppose the market is treading water for quite awhile -- then it takes very little to pierce a moving average.

OK, so maybe now we have a reasonable percentage change causing the event. Ha, now we can do the historical analysis and come up with some trading rules. You could check the data trying various rules like only sell if market is down more the X% and pierces the Y day MA. Then you need another rule to get back in. All you need to do is check the market back a few decades and see which will work. Unfortuneately, it may not work the next time. Also, if you invest in a slice/dice or perhaps tilt to value or have lots of international stock exposure can you really use such rules based on one index? Maybe you need a few more indexes, and on and on and on ....
BTW, I use to do some of this so feel I'm qualified to say it isn't too smart :duh:. All this looks really appealing until you get whipsawed or miss a market turn.

CFB, my hat's off to you on the 2000-2002 trading but personally I don't think this market has the wild look of the large growth 2000 bubble -- on the other hand it has other factors that make it worriesome. I rebalanced 3 weeks ago and will stick with my stock allocation but will not rebalance into stocks unless we get a really nasty decline.

Les

my guess is that it's pretty similar to what Cramer described what he went through in 1987 and 1998 and what was described in the book about LTCM. We might not be heading into recession but so many institutional investors own a lot of this junk housing debt and they are leveraged on their holdings that if things get really bad they will have to sell stock to cover their mortgage investments. there are also rumors that a lot of big pension funds and some big insurance companies are exposed to the mortgage debt market and they may have to sell other investments to cover their cash needs.

we don't have junk companies with no earnings like in 2000, but in the last few years we had a huge credit boom. people bought homes, they went to home depot to renovate their homes, etc. Dupont reported bad earnings because their chemicals are used in a bunch of products related to housing and this thing will probably touch almost every part of the economy
 
My CNN Money site shows a downdraft of 250 on the S&P Friday post-closing.

The business channel talking heads weren't optomistic last night either. I think more blood will flow before this settles out.
 
Oops, that should have been -250 on the DOW. -29.9 for the S&P.
 
:eek:

Yeah, that lump in my throat is my heart, stomach, and possibly a spleen.

Dont DO that to me... ;)
 
The business channel talking heads weren't optomistic last night either. I think more blood will flow before this settles out.

Maybe since all the talking heads are so gloomy, the opposite will take place in the market next week. I'm not counting on it, but I would like to see it just to shut the friggers up. :bat:
 
And splat, we broke the 200 day MA hard.

Hope all y'all have your protective headgear on.
 
glad i noticed the diversion of the MACD and the indexes last month. works pretty much every time in predicting a downtrend. next step is learn enough tech analysis to sell at the top. i'm up only 6.5% for the year instead of the 10% i could have been

usually it lasts 3-4 months before a downtrend starts. this time it was around 2 months. i'll have to check past corrections to see if there is a trend since this is looking like to be a secular bear market that happens every 10 years or so
 
One thing about using charts - you should change the period you are looking at with your time herizon. If you are day trading you look at 5 minute or less charts. If you are investing for ER then you look at weekly.

BigCharts - Interactive Chart
 
Ready?? I thought we were already on a roller coaster. :(
hmmm was wondering what that dropping feeling was ...
having sipped the kool aid, I am waiting for the cycle to complete. Glad I have my 3 year cd 'bucket' in place. ... where is my 2000 calendar?
Best of luck to you dmt's. :D
 
And the single stock that makes up 1/4 to 1/3 of my NW just hit a new all time high on Friday. Damn.:D
 
And the single stock that makes up 1/4 to 1/3 of my NW just hit a new all time high on Friday. Damn.:D
Kumquat, you should take a bit of that and come down to Vegas and put it on red or black.... as I see it, it should not matter to you. :D
... there is a saying you hear in LV all the time ... 'I'd rather be lucky than smart'
In any case... best of luck to you. I hope you continue to be lucky.
 
"The study encompassed the period from late 1979 and until last week, over which time buying and holding the S&P 500 index produced a 10.2% annualized return.

In contrast, a strategy that switched between the S&P 500 and commercial paper according to whether the S&P 500 was above or below its 200-day moving average produced an 11% annualized return. And not only did the strategy market more money than buying and holding, it did so while being significantly less risky than the overall market. That's a winning combination. "

"From Jan. 1, 2000, through the past week, the 200-day moving average strategy analyzed by Ned Davis Research beat a buy-and-hold by 1.8 percentage points per year, on an annualized basis. And it did so while being out of the stock market nearly 40% of the time. The volatility of its returns this decade was 35% less than for buying and holding."
 
What about the S&P500 buy-write ETN?

BXM generated superior risk-adjusted returns over the last 18 years, generating a return comparable to that of the S&P 500 with approximately two-thirds of the risk. (The compound annual return of the BXM was 11.77% compared to 11.67% for the S&P 500, and BXM returns were generated with a standard deviation of 9.29%, two-thirds of the 13.89% volatility of the S&P 500.)

BigCharts - Printer-Friendly Format

Maybe they can make an ETN that follows your strategy, and have it be perfectly tax efficient. Sounds great! Send in a suggestion!
 
Oh its not my strategy, in fact this is a pretty old and fairly basic scheme thats been applied to individual stocks, broad markets, etc. The theory is simple: when something falls sharply enough to break its long term average price, it usually continues to go down for a time. And it drags that long term average with it.

So if you sell on a break to the downside...maybe throwing in 2-5 days of being 'below the line', and buy on a break to the upside...its a very rare circumstance that your buy price is higher than your sell price. And most of the time you're out of the carnage.

Like many other indicators, it fell from favor in the 90's. As mentioned, I dont take it as a buy-sell signal. Just one of the lights on the dashboard.
 
And the single stock that makes up 1/4 to 1/3 of my NW just hit a new all time high on Friday. Damn.:D

What fun is this? Give us the ticker symbol of the stock so we can jeer at you when it crashes and burns. Then you can tell us you sold it all already. The virtual world is great!
 
I thought I'd bump this year old thread a bit and show an updated chart.

As I noted about a year ago, we were about to break the s&p 500's 200 day moving average. A practice of getting out of equities when the s&p's price goes below the line for more than 5-7 business days and getting back in when the price slips above the line for more than 5-7 business days would have kept you out of the slide from 2000 to mid 2003 as well as much of that nasty little slip in 1998.

Turns out it was a good predictor of the current drop as well. Following the same mechanics would have taken you out of the market at about 1480 and you'd still be out. We came up and banged our heads on the line once in mid may before retreating again.

We're on our way back up for another try...

Of course, following this strategy can be tricky when the index is close to the line and whips itself around a while, which is why you have to put a week or so of up-down time into the equation.

Oh, and vanguard most certainly would not like this trading strategy at all.
 

Attachments

  • 200 day ma again.JPG
    200 day ma again.JPG
    126.4 KB · Views: 22
Back
Top Bottom