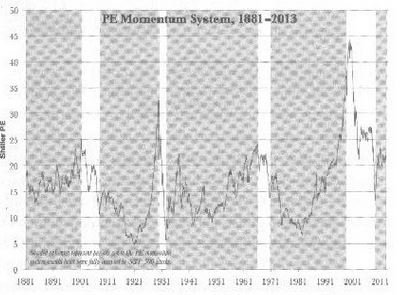
Given that there have been 4 earlier sell triggers in the last 134 years, you can pretty much count on being out of the market for quite a while. In the past, the amount of time out of the market was shorter than being in, but remember, we're looking at 134 years. In the image, the shaded is the time when bought into the market.
I think the selling part is the hard part, because this scheme requires you to sell after a big down draft. It shouldn't be hard to buy back. You wait for the PE 10 to go below 15, then you go into a "track the lowest" mode. So if it goes down, you replace the "15" with the lower value. If it ever goes 6% higher than it's lowest, you buy. So, say your months went 15, 14, 13, 12, 12.5. Your lowest was 12, so you'd need 1.06 * 12 = 12.72 to get back in. 12.5 is not there yet. Then it goes down to 11, that becomes your lowest, so now you'd need 11.54 to get a buy signal. Say it goes to 12, that's your buy signal. You're back in, and all you do now is wait to see 24 again. The problem with this scheme is that most of us won't live long enough to do anything but this trade, LOL!
That's wise. Greed is what gets most of us.
")