ERD50
Give me a museum and I'll fill it. (Picasso) Give me a forum ...
Well, we're not done yet.
If it consistently underperforms, we also have a winning strategy btw.
")
Just my luck, it would start 'working' then!
-ERD50
Well, we're not done yet.
If it consistently underperforms, we also have a winning strategy btw.
That seems odd. Why would an approach take "at least three years"? Sure, a certain strategy might do better in a certain market phase (bull, bear, flat, or other condition), but why couldn't that phase happen right at the start of the experiment? I'm having trouble with that.Goldblatt was clear that it would take at least 3 years, and maybe 5. ....
... Bottom line take away so far for me is that luck has a lot to do with it. If I could start over, I'd do three separate experiments and see how widely they diverged.
Doesn't seem odd to me. Consider:That seems odd. Why would an approach take "at least three years"? ...
The screen on magicformulainvesting.com gave me a list of 50 stocks that ranked the highest on Goldblatt's valuation technique. I pasted those into a spreadsheet, typed =Rand() in the adjacent column and sorted the list. So, yes, using a computer and applying a mechanical, repeatable process.
Well, we're not done yet.
If it consistently underperforms, we also have a winning strategy btw.
I'm not going to try to boho the situation...
Originally Posted by sengsational View Post
I'm not going to try to boho the situation...
And a new word enters our lexicon here at ER.org! I think we continue to use it and make people wonder what it means for a while. Or pick it up in context.
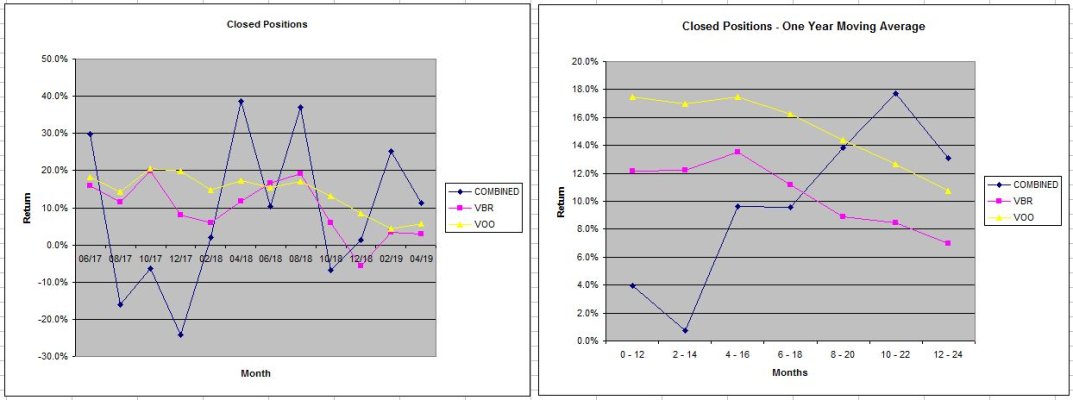
The 2018 June picks turned in an horrific result of -38.5%. The small cap benchmarks got hit a little bit, and the S&P showed a nice gain over the span. This batch wiped out all earlier gains accumulated in the scheme, and took the overall results negative. ...
Do not associate me with threads in which I do not post, I have never commented or contributed to it as I hold a negative opinion of the strategy after reading the book. I am willing to be held accountable for individual stock investments that I actually propose.I just looked and we are 3 years into this. Wow, seems like the "Magic Formula" is a disappearing act, for your money!
(I fat-fingered "disappearing", and spell checker recommended " diapering" - hmmm, that might work too?)
Do you have a month-to-month chart/table of the MF picks (hmm, maybe MF fits too?) versus Total Market or SPY? I'd guess that not only did it under-perform, but also had a much higher standard dev. All rather interesting, as any picks really should average out over time. It should be as difficult (or as easy) to pick under-performers as it is over-performers. I wonder if the results were different, would people be thinking this was a good system?
Chalk up another tick-mark for passive investing. We'll see what Running_Man comes up with next.
-ERD50
Oh, I disagree. Failed experiments have significant value. IMO that is particularly true in investing and on forums where successes are trumpeted, claims based on backtesting are frequent, and failures are rarely mentioned.Starting to move into "can't come back from that" territory. Pity.
Do not associate me with threads in which I do not post, I have never commented or contributed to it as I hold a negative opinion of the strategy after reading the book. I am willing to be held accountable for individual stock investments that I actually propose.
Do you have a month-to-month chart/table of the MF picks (hmm, maybe MF fits too?) versus Total Market or SPY? I'd guess that not only did it under-perform, but also had a much higher standard dev. All rather interesting, as any picks really should average out over time. It should be as difficult (or as easy) to pick under-performers as it is over-performers. I wonder if the results were different, would people be thinking this was a good system?
... I'm not sure what you're looking for here. Every pick's buy/sell dates and prices are in this thread, posted the day of the buy or sell. You're thinking of a price over time chart? I haven't been "marking to market", just have been documenting the buy and sell dates and prices, so the points are one year apart.
Yeah, and getting worse!Starting to move into "can't come back from that" territory. Pity.