How does this decline compare to previous recessionary ones?

Our current situation reminds me of the late 70's and early 80's where we had a Bear market, high inflation, and rising oil prices. We also had interest rate increases that more closely matched the inflation rates, something we don't have today. The Fed may change the interest rate situation. We'll see.

In real terms 70's-80's market took over a decade to break even in real terms. Hang on.
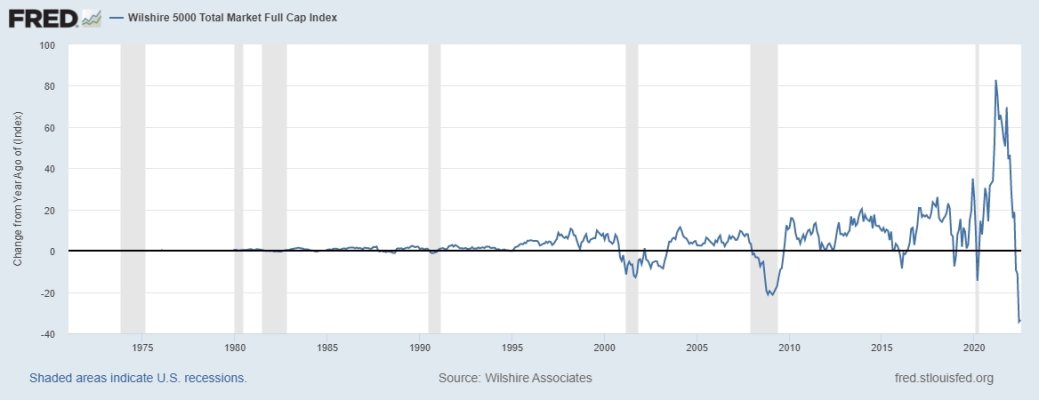
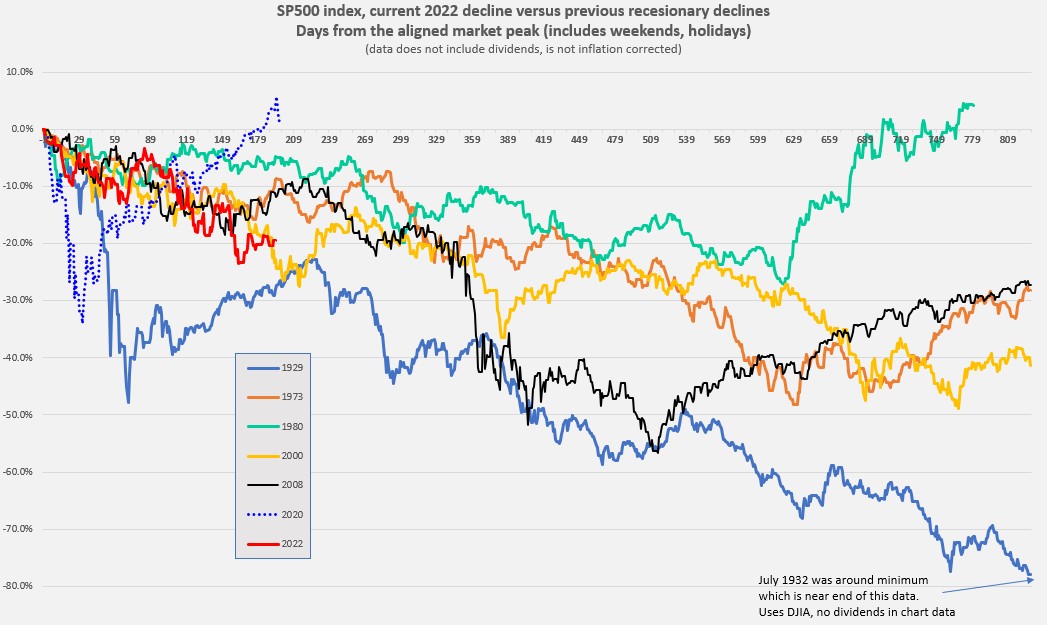
Heh, heh. Hope I have a decade. Yes, I'm hanging on! Hoped I would never have to go through the '70s again.
 
UPDATE: Another month has gone by and the chart shows results through July 15.

image2.jpg


It seems like this has been the most anticipated recession in history and so far this is not an official recession (as called by the NBER). Employment statistics are robust.

FWIW, I am hoping for a move up to -10% from the November high.
 
Thank you for the charts. Much appreciated.
Looks like we are heading to the second worst recession.
 
Great chart!
Yes it looks close to 2000. But as anyone can see, all downturns are different and this one is not an exception.
 

Attachments

  • fredgraph.jpg
    fredgraph.jpg
    89.7 KB · Views: 74
UPDATE: Another month has gone by and the chart shows results through July 15.

image2.jpg


It seems like this has been the most anticipated recession in history and so far this is not an official recession (as called by the NBER). Employment statistics are robust.

FWIW, I am hoping for a move up to -10% from the November high.

Great chart once again. Thanks
 
The 1920's (low 400% growth) had a very similar run up to the 2010's (high 400%) for SP500. The 1920's had a very dangerous period of deflation though, and was eventually followed by 1970's style inflation. So probably it will be better than the worst crash ever, but worse than 2008.

CPI chart below:

chart
 
Last edited:
UPDATE: Another month has gone by and the chart shows results through July 15.

image2.jpg


It seems like this has been the most anticipated recession in history and so far this is not an official recession (as called by the NBER). Employment statistics are robust.

FWIW, I am hoping for a move up to -10% from the November high.
So with the exception of the 2020 rescission (Covid outlier) if this one follows the patterns of the past, we still have a good ways to go... Maybe another year, or more. Unless of course, this one is different.
 
Last edited:
There were at least 2 declines that did not segue into recessions, 1962 and 1987.

First, this chart is not suggesting any particular future.
Second, I produced the chart to remind myself how really extended recessionary bear markets behave. I included weekends and holidays to show how drawn out such market torture could become.

Hopefully we do not fall into recession or we have a recession but it is mild and already discounted by the declines to date.
 
Last edited:

Attachments

  • fredgraph1.jpg
    fredgraph1.jpg
    132.1 KB · Views: 48
Hopefully we do not fall into recession or we have a recession but it is mild and already discounted by the declines to date.
Personally, I think we've been in a recession most of this year or longer. Maybe because of lingering supply chain issues, high inflation, war in Ukraine, high oil prices, slow wage growth, etc...
 
Last edited:
UPDATE: After about a month we see a nice rise. Is this a "bear market rally" or the start of a new bull market? Anyway, I'll take it.

Also a reminder, this just tracks the current market against previous recessionary bear markets. It is not meant to say we are in a recessionary bear market.

image4.jpg


FWIW: I will now use this rise to rebalance to my preferred AA. For me, this means selling a few percent equity ... just to do the best with our assets no matter which way this goes, recession or not.
 
When I see the decent rise of 2022, my eyes go to the market line just below (1929). Then I search for similar rises, and it becomes a jumble in my mind.

I guess the lesson is, "Follow your asset allocation."
 
UPDATE: After about a month we see a nice rise. Is this a "bear market rally" or the start of a new bull market? Anyway, I'll take it.

Also a reminder, this just tracks the current market against previous recessionary bear markets. It is not meant to say we are in a recessionary bear market.

image4.jpg


FWIW: I will now use this rise to rebalance to my preferred AA. For me, this means selling a few percent equity ... just to do the best with our assets no matter which way this goes, recession or not.

This is great data. Any chance I could get a copy? I want to run the data with dividends and corrected for inflation.
 
The worst market I have even been in was the one that started in 1974. The depth and length of that dive was breath taking. IIRC, it took the US stock market over a decade to recover in real terms. Business week ran its famous issue back then. See below.

This market is a cream puff compared to that one so far. Of course, this BEAR may or may not be heading back to its den for a long period of hibernation. We don't know.
 

Attachments

  • death of equities.gif
    death of equities.gif
    375.6 KB · Views: 49
Thank you for continuing to update this graph, Lsbcal. I find it interesting, and I've used it to provide perspective to others considering rash financial moves.
 
I was kind of hoping the market would drop to 25% off highs or lower because I was moving out of my fixed interest stable value fund at work that pays 1.46% net, and I only got 20% of it moved at the 15% and 20% drop levels before the market went back up. At least it looks a lot better now looking at my total stash $ though.
 
Back
Top Bottom