SecondCor521
Give me a museum and I'll fill it. (Picasso) Give me a forum ...
1.35 years, 124. 90/10 VTSAX/VBTLX, very small inheritance received (3 out of the 124), very small WR (net 0.3%).
Last edited:
Well, since I was 39 when I retired, and looking at a likely long retirement, potentially 50+ years, I wasn't so aggressive at spending those first 10 years, even though we did have a few of big ticket items (fancy RV, new house, cars).Only REWahoo and MichaelB are doing it right with the long-timers so far (probably spending enough). If you're inflation adjusted significantly "up", and you've been retired a dozen or more years, are you really spending enough? Or maybe the thread only attracts the conservative types.
Total inflation from December 2011
to April 2017 is 8.35%
$1 after inflation is $1.08
This would have been an interesting question to ask in 2009 for retired folks and then compare it to today's numbers.
This would have been an interesting question to ask in 2009 for retired folks and then compare it to today's numbers.
Yep. Instead of 110 my number would have been closer to 70, only four years after retirement. That situation really interfered with my daily nap.
This would have been an interesting question to ask in 2009 for retired folks and then compare it to today's numbers.
My data from the 2009 time period showed my numbers were up a little due to my extremely conservative investments. (No equities at all in 2008/09) Today most of my money is still in what I consider conservative investments, but I have placed some of my more discretionary dollars in equities over the past few years. Altogether, at this point, I'm up about 15% since I retired.In late Feb 2009, our net worth was down 40% from the peak in Oct 2007, and down 6.5% from the starting value in Aug 1999.
Taking into account inflation (i.e. in real terms), in Feb 2009, our net worth was down 33% from when we retired!
It had recovered (broken even) in real terms by Dec 2009.
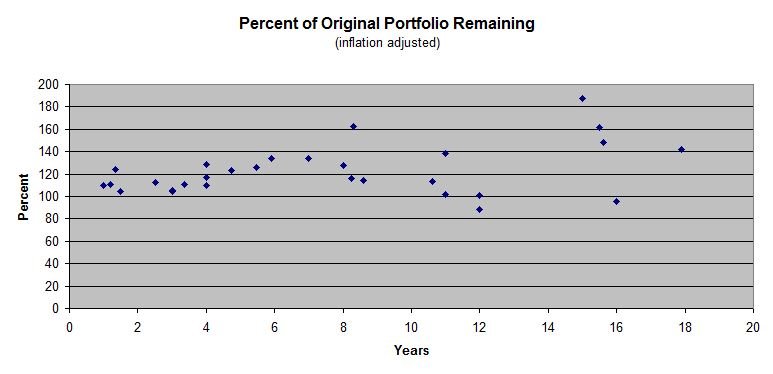
15.5 years - 218Thought it might be interesting for folks who have ER' d to state how many years they have been retired and how their portfolio values today compare to the values when you retired (using a value of 100 for when you retired)
For me. 4.75 yrs. 129
I find it very difficult to apply CPI statistics to my personal situation - particularly since retirement 15 years ago. I would expect my personal expenditures to roughly track the CPI but that's not the case at all.If folks want to look at real growth over their retirement, this tool is handy. Then you subtract the inflation number (given in %) from your growth. I usually just enter in $1 for the starting amount, because I'm only interested in the % inflation result. https://inflationdata.com/inflation/inflation_calculators/Cumulative_Inflation_Calculator.aspx
For a given period, start with the prior month. For example, for inflation from say Jan 1 2012 to the most recent CPI, use the range Dec 2011 to April 2017. It gives an answer like:
Data through May is not available yet, but should be next week (6/14). The calculator is usually updated by the end of the day that CPI is announced.
39 is really outside of the band I had been considering. I was thinking ER was 55 +/- when I made my comment.Well, since I was 39 when I retired, and looking at a likely long retirement, potentially 50+ years...
Isnt this similar to the graph FIRECalc creates when they compare success outcomes for the different scenarios? How much money you have leftover after so many years?39 is really outside of the band I had been considering. I was thinking ER was 55 +/- when I made my comment.
Just for fun, I plotted the data using the CPI numbers from an "Irrational Exuberance" spreadsheet I already had.
I find it very difficult to apply CPI statistics to my personal situation - particularly since retirement 15 years ago. I would expect my personal expenditures to roughly track the CPI but that's not the case at all.
My expenditures have roughly remained the same at a 60-70K annual level and my standard of living feels about the same - buy about the same things ( including cars and vacations) eat out as often etc. I really don't know why this is so. Since there is so much freedom in retirement maybe subconsciously I adjust and substitute?