How does this decline compare to previous recessionary ones?

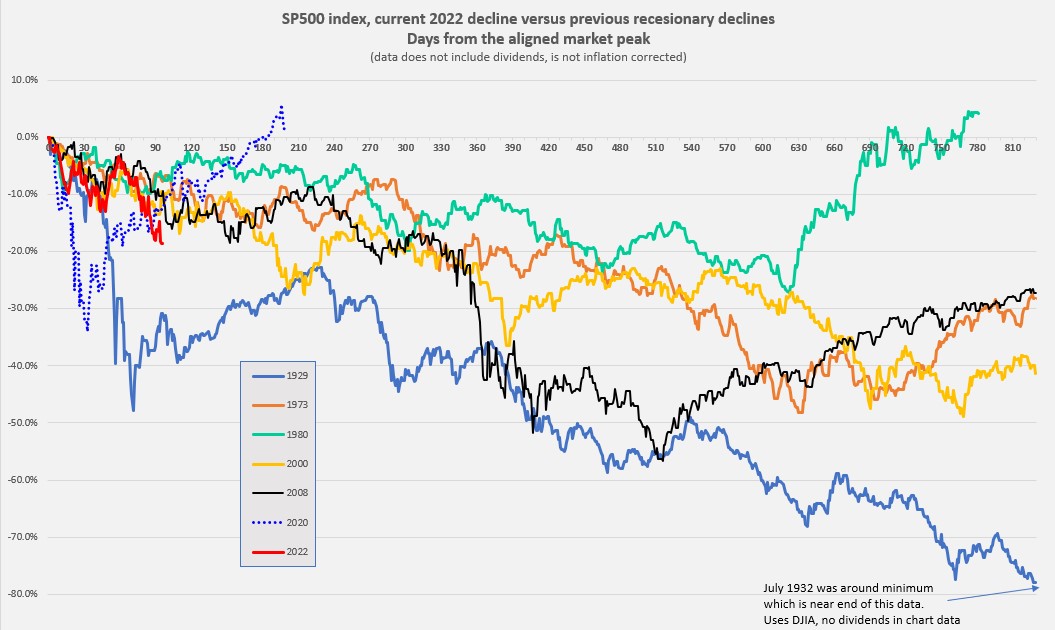
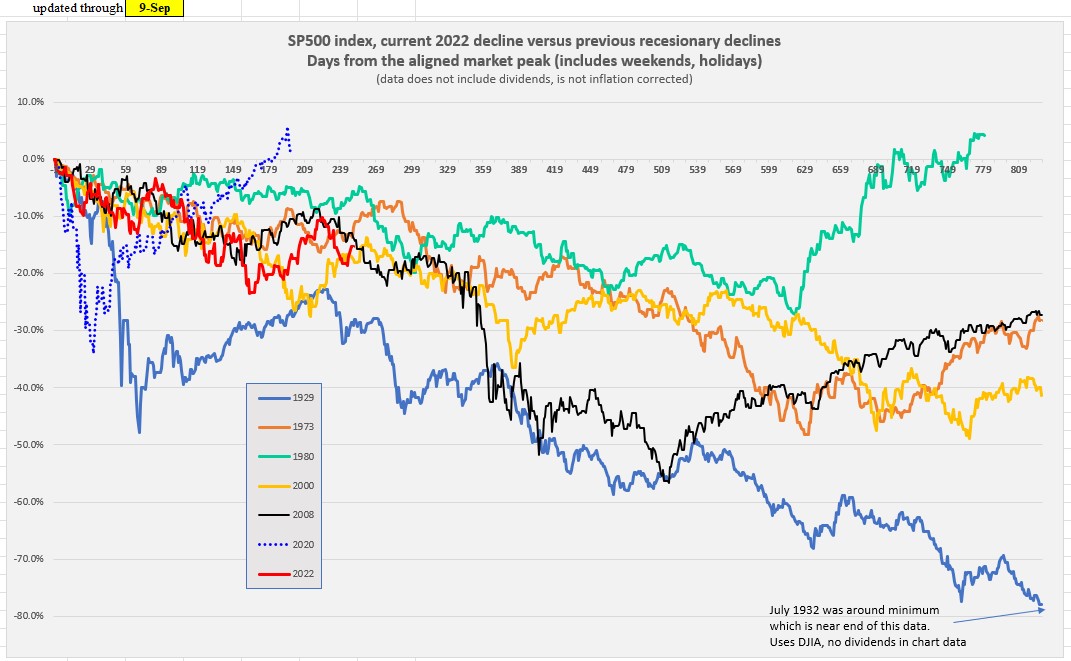
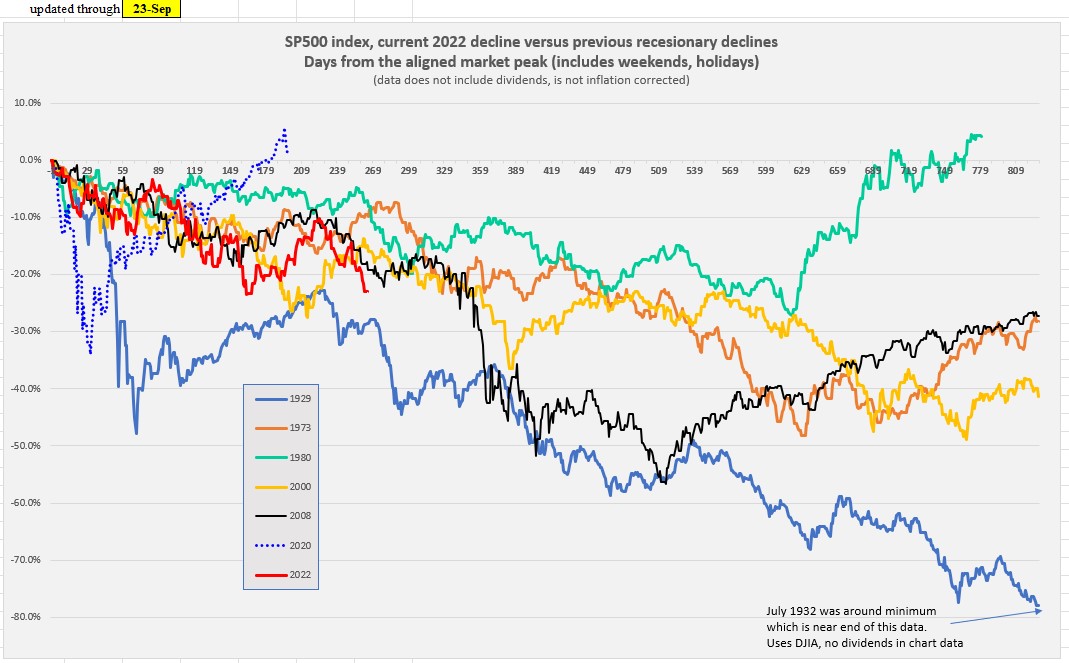
The worst market I have even been in was the one that started in 1974. The depth and length of that dive was breath taking. IIRC, it took the US stock market over a decade to recover in real terms. Business week ran its famous issue back then. See below.

This market is a cream puff compared to that one so far. Of course, this BEAR may or may not be heading back to its den for a long period of hibernation. We don't know.

Yeah, the 74 on recession/oil shock/stagflation/etc. was a lot worse than now - so far. We never know where things are heading and there are a lot of new players on the scene that can affect the situation. I have kind of an uneasy feeling about things - not that there is much I can do about it. I'm revisiting my back-ups to be certain they are still viable but hope I don't need to exercise any of them. YMMV
 
I was kind of hoping the market would drop to 25% off highs or lower because I was moving out of my fixed interest stable value fund at work that pays 1.46% net, and I only got 20% of it moved at the 15% and 20% drop levels before the market went back up. At least it looks a lot better now looking at my total stash $ though.

The SP500 declined 23.4% between Jan 1 and June 15. You almost got your wish.

As many have pointed out over the years, market timing is hard.
 
Market timing is indeed hard. Only a few can be right, or lucky to be right.

I still recall the decline after the 2000 tech/dot-com bubble reached the peak in March 2000. The Nasdaq recovered some in August 2000, before sliding into the abyss.

Just a few days ago, Jamie Dimon of JP Morgan Chase said the risk of a bad recession was still there. And if it happens, there's no way the market can stay at the current level.

If I could be sure that the market would not decline, I would be 100% in stock. Of course I am not. Never was.
 
I was just moving 10% of my fixed interest account with each 5% drop level in the market beginning at the 15% drop level rather than trying to time the market low. Yes, there could still be a recession and/or more significant drop in stocks. If it gets down to 25% from the high, I'll move more.

This wasn't in my plans originally because the retirement stable value fund was paying a little more than double at 3% net for over a decade, which is why I had invested in it to begin with. But with the sudden cut to 1.46% net along with high inflation, I had to start looking at opportunities to move out of it without buying at market highs. Getting 20% moved with stocks down 15% to 20% is better than nothing, without trying to time the market low.
 
Last edited:
I wanted to compare the decline from the November 2021 peak to previous recessionary market declines. It appears we are not currently in a recession but one could come about in future months. Unemployment is declining and should that reverse it would be very negative I think.

So I took daily data from several bad markets that included a recession and aligned the peaks. The Y-axis is days from the peak in calendar days (not trading days). The chart below shows where we are as of May 20, 2022 (red line). The SP500 is down -18.7% from the peak 97 days ago (not counting dividends). This is worse then all but the 1929 decline and the 2020 pandemic decline. The 1929 data is from the Dow Jones Industrial average and that period included deflation plus larger dividends then now.

Maybe we get a bounce up from here? Even in previous bad markets there were jagged rallies upwards. As usual, this is only historical and does not tell us what the future holds. Sorry about that :(.

If there is some interest, I will update this chart from time to time.


image2.jpg
Thanks, outstanding data.
 
One thing that would be nice to know is the date of the beginning of each series. I think it was said that the peak was used.

Here are the dates for the peaks:

9/3/29
1/11/73
11/28/80
9/1/00
10/10/07
2/19/20
1/3/22
 
UPDATE: Another month has passed and we are currently down -15.2% from the January 3rd peak (red curve). There were some dividends since then which gives us maybe about another +0.8%.

Still no apparent recession yet so the backdrop of recessionary declines is kind of biasing this chart. Last month saw a slight rise in unemployment and a small decline in CPI (deflation).


image2.jpg


FWIW: I used the previous rise in August to adjust my AA to fit our needs. So I sold some equities and bought some individual 5 year TIPS recently.
 
UPDATE:

Still no apparent recession yet so the backdrop of recessionary declines is kind of biasing this chart. Last month saw a slight rise in unemployment and a small decline in CPI (deflation).

I'm no expert so am willing to be corrected if I'm looking at "inflation/deflation" incorrectly. My understanding is that the rate of yearly inflation dropped around half a percent. IOW we're still looking at inflation of roughly 8.5% per year instead of 9% per year. Better than going the other way, but I wouldn't think that would be called "delation" yet. Let me know if I am wrong. Since there were a couple of big drops in the energy world (year over year) that makes the monthly inflation appear to be negative. But at the month level, its more like noise than a number - but again, I'm willing to stand corrected. Not trying to be obstinate. Just want to understand.

My 55 year old calculous would state that "inflation rate had a negative 2nd derivative." YMMV

The CPI went down in July. Probably that is too short to call it deflation so I was exaggerating and this probably shows my bias to get rid of inflation and let the economy (and stock market) prosper.

There was a discussion elsewhere of short term TIPS rates. This depends on the short term CPI numbers. I think they those short TIPS rates are suggesting the market expects quite a reduction in CPI rises, maybe we could call it short term disinflation?
 
I'm no expert so am willing to be corrected if I'm looking at "inflation/deflation" incorrectly. My understanding is that the rate of yearly inflation dropped around half a percent. IOW we're still looking at inflation of roughly 8.5% per year instead of 9% per year. Better than going the other way, but I wouldn't think that would be called "delation" yet. Let me know if I am wrong. Since there were a couple of big drops in the energy world (year over year) that makes the monthly inflation appear to be negative. But at the month level, its more like noise than a number - but again, I'm willing to stand corrected. Not trying to be obstinate. Just want to understand.

My 55 year old calculous would state that "inflation rate had a negative 2nd derivative." YMMV

8.5% year over year inflation in July 2022 means only that the CPI was 1.085 times the CPI in July 2021. Thus, it can tell you that prices have gone up by 8.5% since last, but not that they currently are going up by 8.5% per year.

If prices remained absolutely unchanged for the next six months (so CPI Jan 23 = CPI Jul 22), the reported inflation rate in January 2023 would still be 5.4% on a year over year basis, because it reflects history. If you looked at the headline inflation rate, you'd say "gosh, inflation is still high", but in reality, prices would have been unchanged for the last six months.

In my opinion, focusing on the year over year headline inflation rate does not give an accurate picture of what is happening right now and what is likely to happen in the immediate future, which is what I need to deal with. What has happened in the past year is water under the bridge.


P.S. - I think the consumer price index is the function of the variable and inflation rate is the first derivative. If x1 = x2 then dx/dt = 0. The second derivative of the function would be the rate of change of the rate of inflation and would be negative. To analogize, if x is position, dx/dt is velocity, and d^2x/dt^2 is acceleration. In July, position(CPI) was essentially unchanged, speed was zero and acceleration was negative. (that's my 45 year old calculus)
 
Last edited:
UPDATE: Another month has passed and we are currently down -15.2% from the January 3rd peak (red curve). There were some dividends since then which gives us maybe about another +0.8%.

Still no apparent recession yet so the backdrop of recessionary declines is kind of biasing this chart. Last month saw a slight rise in unemployment and a small decline in CPI (deflation).


image2.jpg


FWIW: I used the previous rise in August to adjust my AA to fit our needs. So I sold some equities and bought some individual 5 year TIPS recently.

Seems like we are cruising along on a repeat of 2000 path.
 
P.S. - I think the consumer price index is the function of the variable and inflation rate is the first derivative. If x1 = x2 then dx/dt = 0. The second derivative of the function would be the rate of change of the rate of inflation and would be negative. To analogize, if x is position, dx/dt is velocity, and d^2x/dt^2 is acceleration. In July, position(CPI) was essentially unchanged, speed was zero and acceleration was negative. (that's my 45 year old calculus)

Showing off again, huh?

I took 6 calculus courses in engineering college and I can't even speel calculus any more!:LOL: (thanks speel check)
 
Seems like we are cruising along on a repeat of 2000 path.
Actually, we are gliding close to the 2007-2008 path at the moment Look at the magnitude and duration of the initial drops and retracements:

_____________2007-08___2022
Initial drop:___20.3%__24.5%
______length:____158____164 (calendar days)
First retrace:__57.4%__58.3%
_______length:____63_____60
Second drop:____48.6%____??
_____length:_____186_____??


An identical magnitude and length of the next drop would put the SPX at about 2100 in mid-February.

NOTE: THAT'S ANALYSIS. NOT A PREDICTION. I HAVE NO IDEA IF THE MARKET IS GOING TO BE AT 2100 OR 5100 IN 5 MONTHS.
 
Some guy is saying the correlation for 1973-2022 2-year analog SPX is 91%.
https://www.investing.com/analysis/2022-bear-could-be-tracking-19731974-200627089

I started my first job out of college in 1976, so I missed that 1973 thing. I'll bet my Dad took a beating.

I can't believe it's been all but 50 years. I remember living that time (and chart) very well. Just had a few years in at megacorp and watched the precursor of the 401(k) plummet after all that money I'd put into it. I suspect part of my reticence to go all in in the stock market over the years stems from that time. YMMV
 
I can't believe it's been all but 50 years. I remember living that time (and chart) very well. Just had a few years in at megacorp and watched the precursor of the 401(k) plummet after all that money I'd put into it. I suspect part of my reticence to go all in in the stock market over the years stems from that time. YMMV
I agree with you. I think I detect that same feeling in other posters. Since I had very little, there were no indicators of consequence.

My highs and lows came from other pursuits.
:angel:
 
Posting this because we hit a new low today of -23% from the Jan 3rd peak.


image3.jpg


Should we not expect pain when bond rates have had a historically fast, sustained rate rise? Not saying I anticipated this in equities even though I avoided the bond route. :facepalm:

Ugly, ugly, ugly.

I keep my sanity by calculating the years of spending we would have if the equity market declines further to -50% of it's high.
Should see us into our late 90's even if no snap back. :wiseone:
 
Last edited:
Ugly, ugly, ugly.
I'll say!

I keep my sanity by calculating the years of spending we would have if the equity market declines further to -50% of it's high.
Should see us into our late 90's even if no snap back. :wiseone:

Good idea. That helps. Another thing that helps me, is to remember that even though I can't control returns without selling, I can still control spending to some extent. So, I try to keep spending down as much as I can.
 
Back
Top Bottom